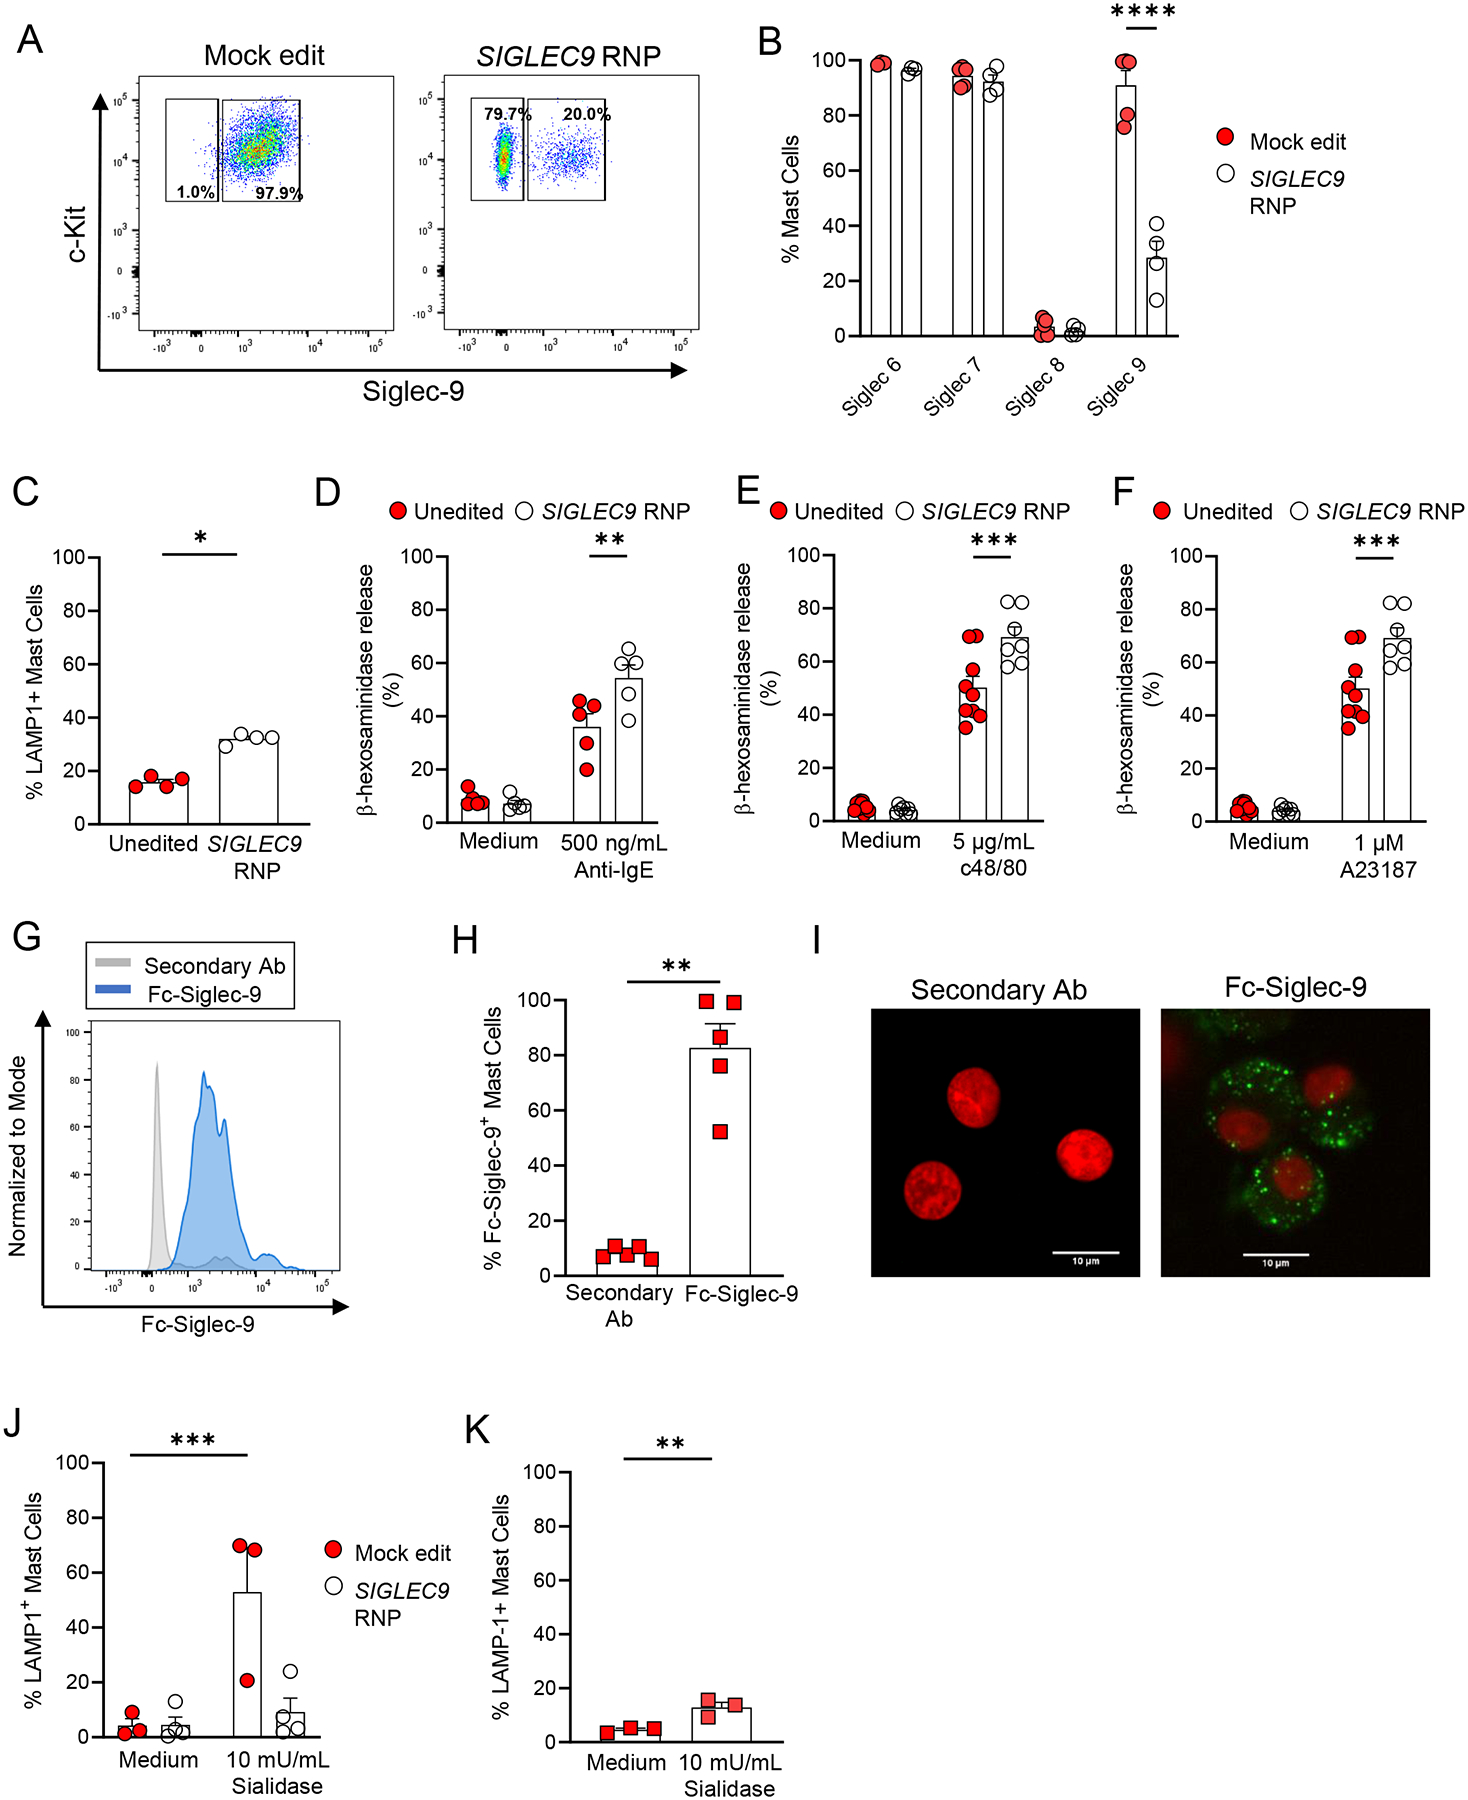
Figure 3. Siglec-9 interactions with sialic acids in cis limit mast cell activation.

Representative flow cytometry analysis of Siglec-9 expression of mock- and SIGLEC9-edited LAD2 cells. (B) Siglec surface expression in mock- and SIGLEC9-edited deficient LAD2 cells. (C) LAMP-1 surface expression in unedited and SIGLEC9-edited deficient LAD2 cells maintained in medium alone. (D-F) β-hexosaminidase release by unedited and SIGLEC9-edited LAD2 cells upon activation. Unedited and SIGLEC9-edited cells were sensitized with IgE (2 μg/ml) overnight and then were challenged with either anti-human IgE (500 ng/ml) (D), compound 48/80 (c48/80) (5 μg/ml) (E), or calcium ionophore (A23187) (1 μm) (F) for 1 h. (G-I) Representative flow cytometry analysis of Siglec-9 ligand expression (G), percentage (H) of HSCMCs expressing Siglec-9 ligands. (I) Representative fluorescent microscopy images show cell surface binding of Fc chimera Siglec-9 protein in HSCMCs (green in right panel). Nuclei were counterstained with DAPI (red fluorescence). Negative control was performed with secondary antibodies only (left panel). Scale bar equals 10μm. (J-K) LAMP-1 expression in unedited and SIGLEC9-edited LAD2 cells (J), and HSCMCs maintained in medium alone or treated with sialidases (10 mU/ml) for 1 h. Flow cytometry data in A and G, and microscopy images in I are representative of 2–3 independent experiments. Data in B (n = 4), C (n = 4), D (n = 5), E (n = 7), F (n = 5–8), H (n = 5), J (n = 3–4) and K (n = 3) are shown as mean + SEM. Circles in B-F and J show values from individual experiments with LAD2 cells. Squares in H and K show values from individual experiments with cells generated from individual donors. *P < 0.05, **P < 0.01, ***P < 0.001, ****P <0.0001.
