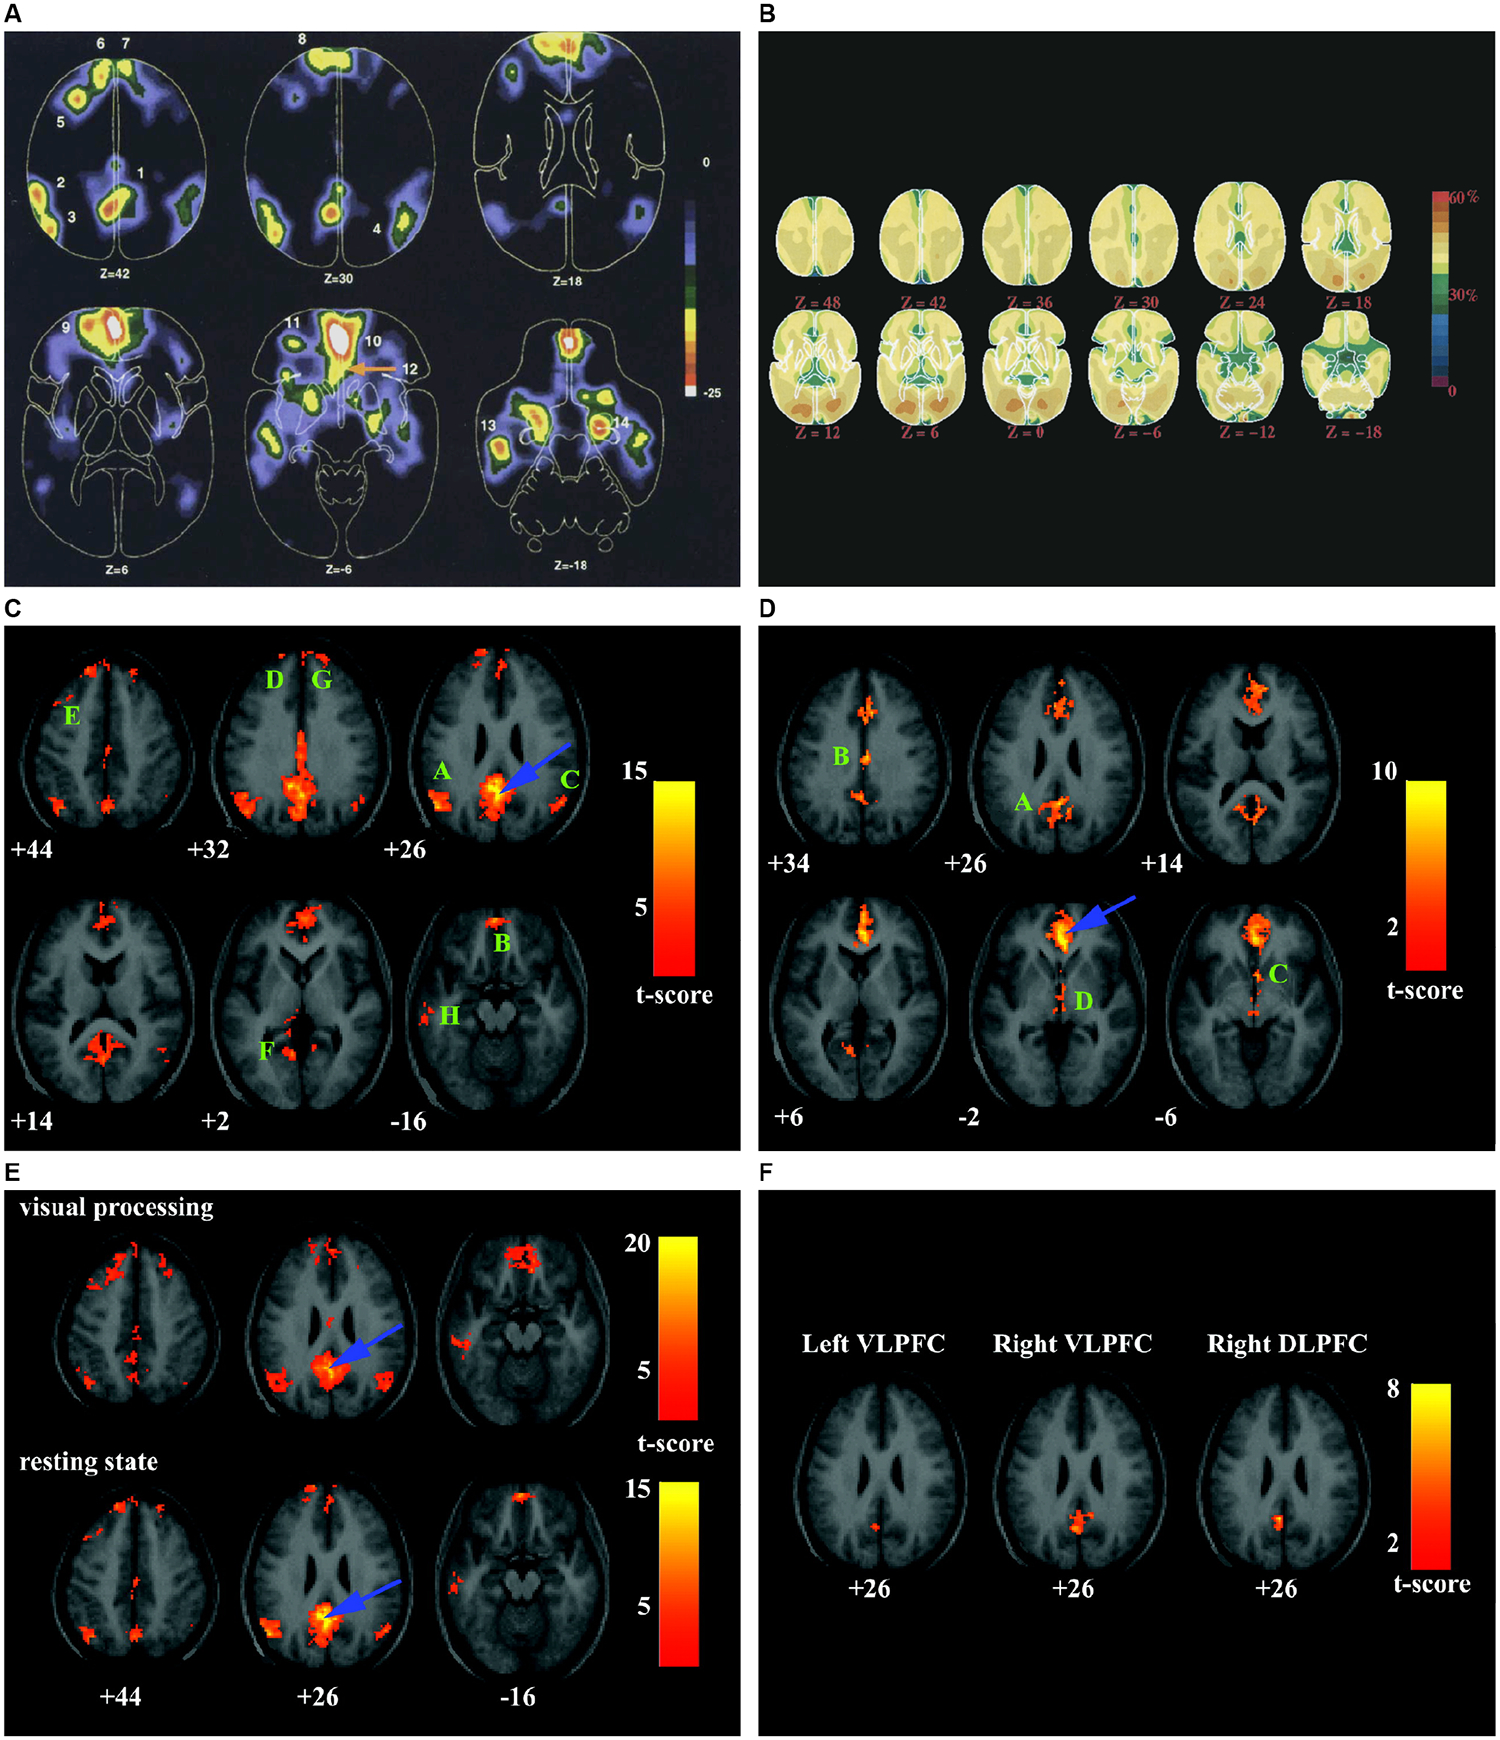
Figure 2. Key findings leading to discovery of the DMN.

(A) Blood flow decreases in active task minus passive control scans across nine PET functional brain imaging studies. Numbers indicate the 14 brain areas that showed decreased activity when participants processed a visual image in an active task, contrasted with passive viewing in the control state. Adapted from7. (B) Maps of the fraction of oxygen extracted by the brain, showing increases in visual cortex bilaterally. Despite an almost 4-fold difference in blood flow and oxygen consumption between gray and white matter, the fraction of oxygen extracted is relatively uniform, emphasizing the close matching of blood flow and oxygen consumption in the resting, awake brain. Adapted from1. (C) Intrinsic functional connectivity of the PCC (peak blue arrow). Eight significant clusters labeled A–H encompass AG, mPFC, MTG, and MTL. (D) Intrinsic functional connectivity of the vACC (peak at blue arrow). Four significant clusters labeled A–D encompass dorsal PCC/precuneus, rostral PCC, nucleus accumbens, and hypothalamus/rostral midbrain. (E) PCC connectivity patterns during low-level visual processing and the resting-state display similar features. (F) PCC fluctuations are inversely correlated with ventrolateral and dorsolateral PFC. Adapted from2.
