
Figure 1:
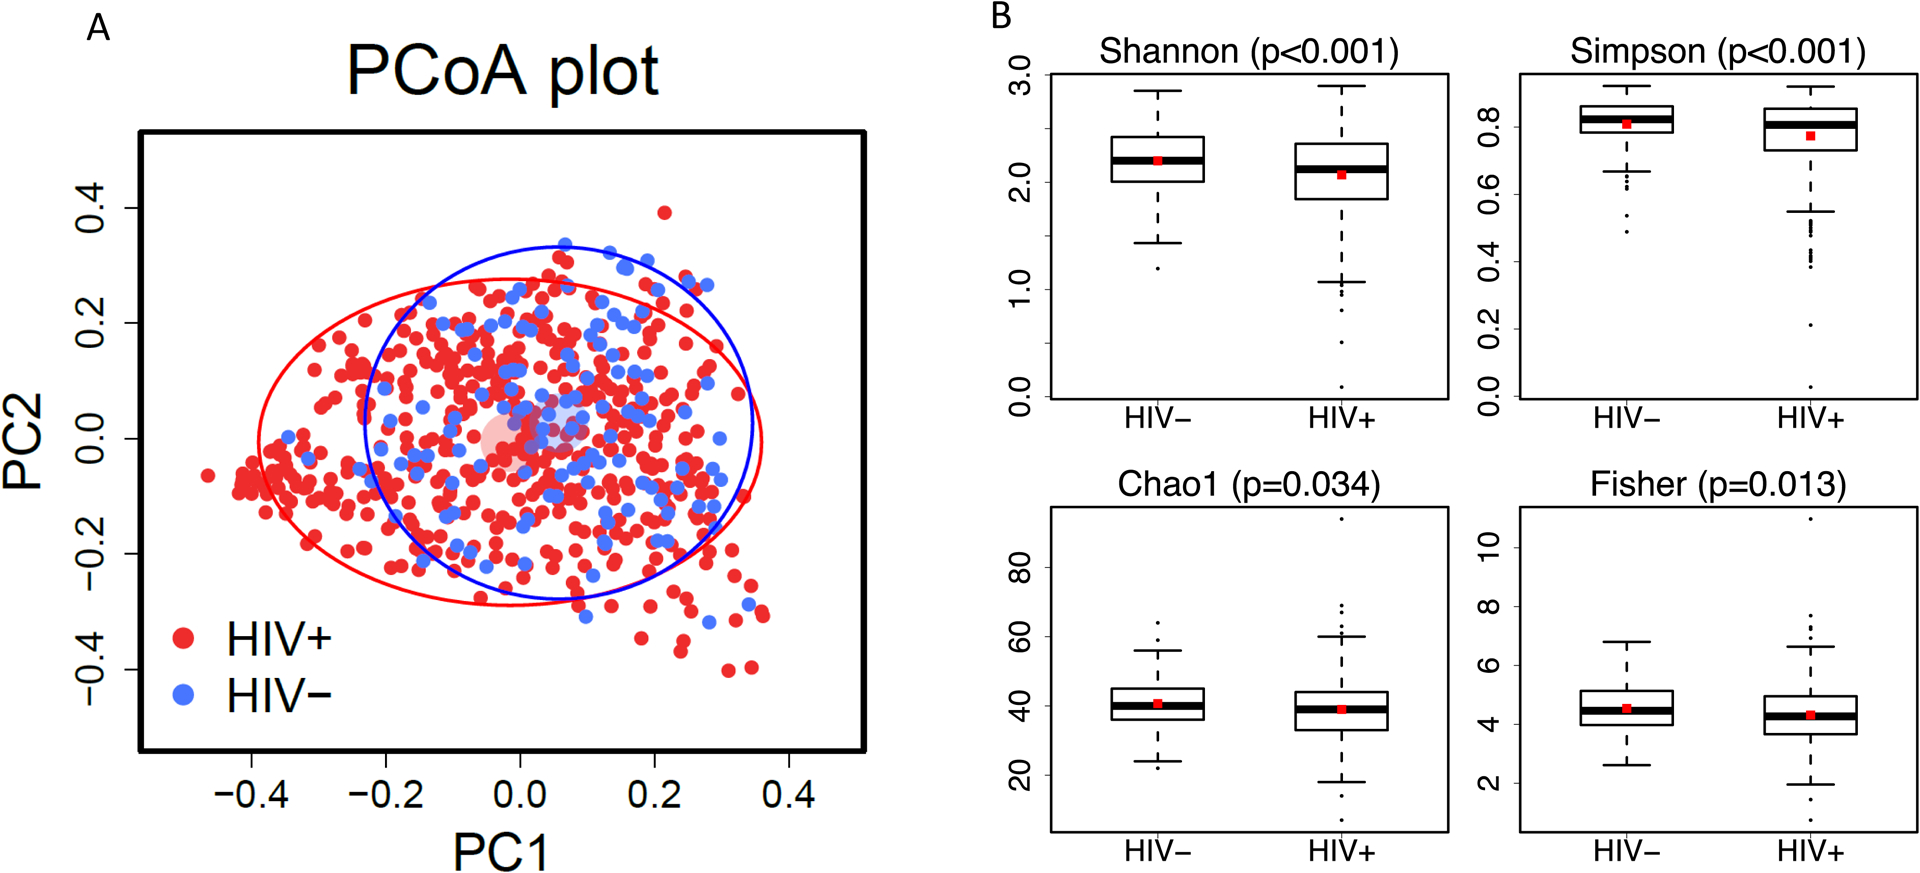
A. Principal coordinates analysis (PCoA) based on Bray-Curtis distances showing 476 children living with HIV as red dots and 123 children who are uninfected as blue dots. The lighter colored circles plot the means of the first two principal coordinates with arbitrary radius. The solid ellipses plot the variation of the principal coordinates with semi-major and semi-minor axes being two standard deviations of the principal coordinates. B. Alpha diversity indices (Shannon, Simpson, Chao1, Fisher) by child HIV status.