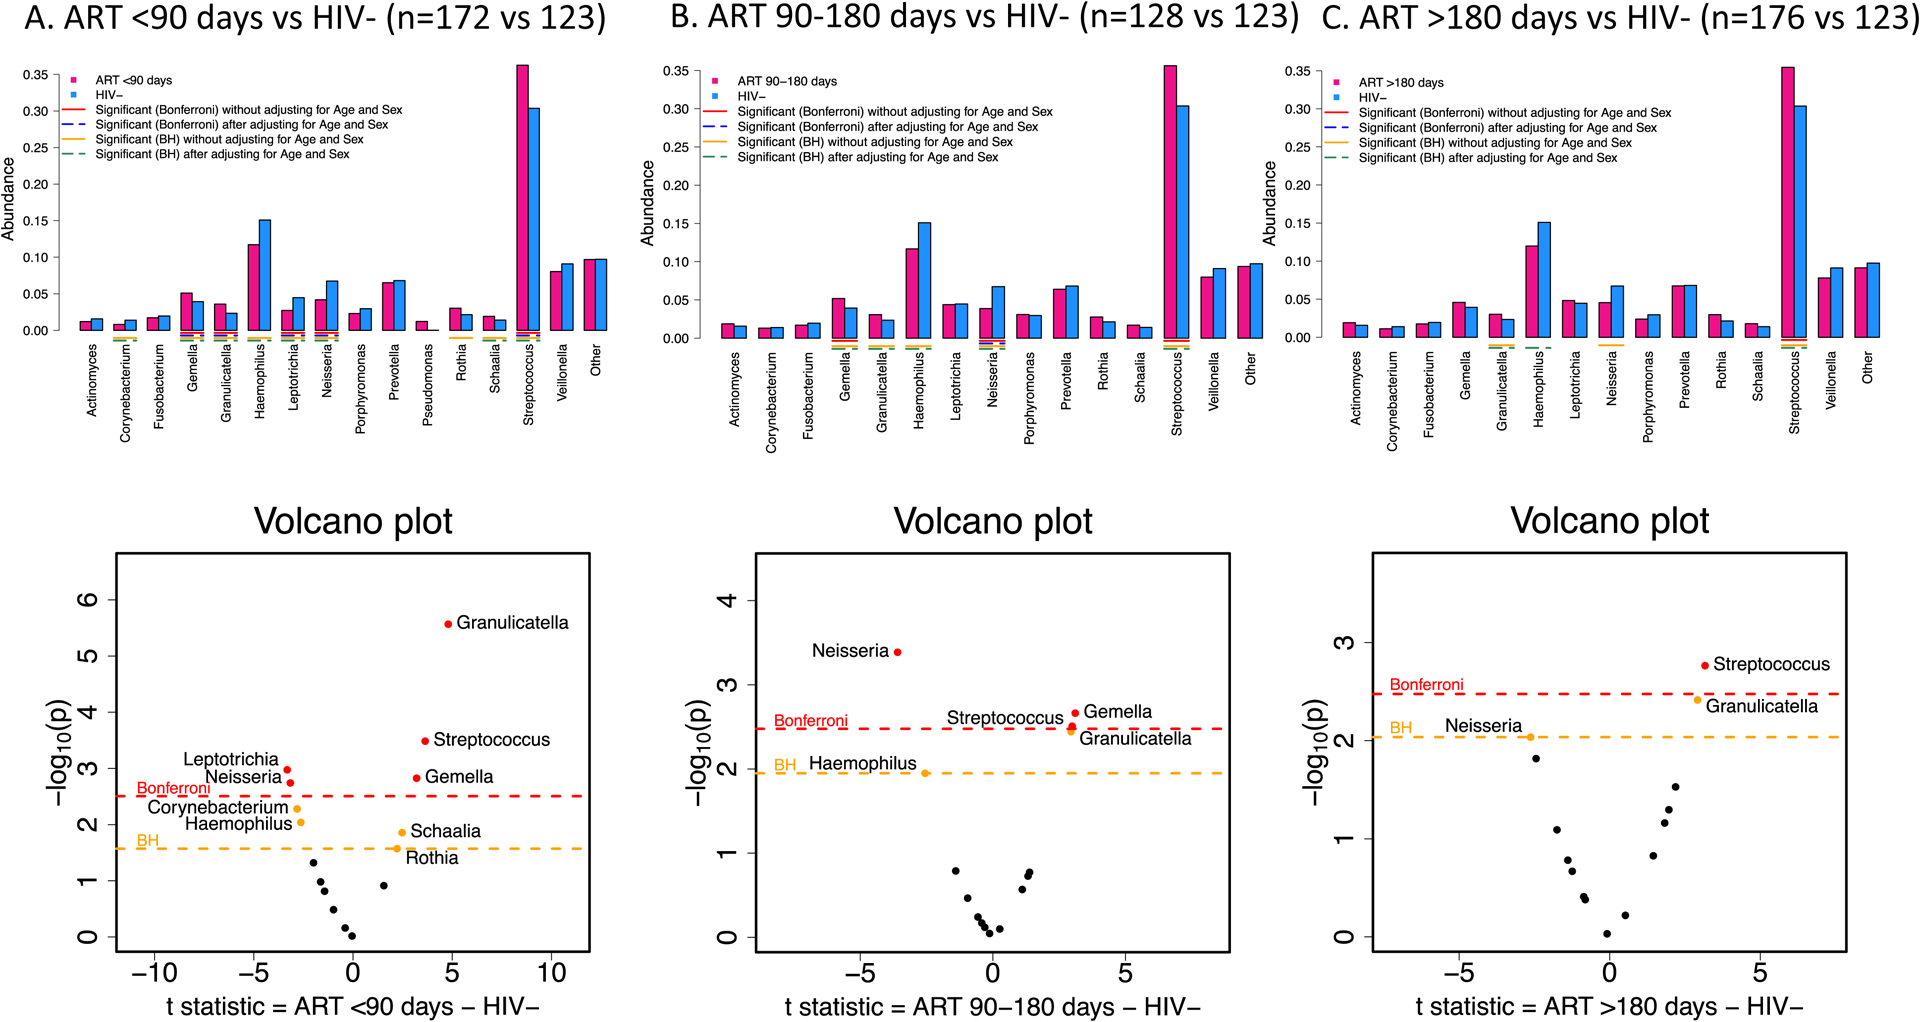
Figure 3:

Barplots of mean abundances for each of the 15 Genus-level taxa (16 taxa in panel A with the inclusion of Pseudomonas) and corresponding volcano plots using t-statistic among A. 172 children living with HIV who started ART <90 days of age B. 128 children living with HIV who started ART 90–180 days of age and C. 176 children living with HIV who started ART >180 days of age compared to 123 children who are uninfected with significant differences between the groups before (red line – Bonferroni adjustment, yellow line Benjamini-Hochberg (BH) adjustment) and after (blue dashed line – Bonferroni adjustment, green lines BH adjustment) adjusting for age and sex of the children.
