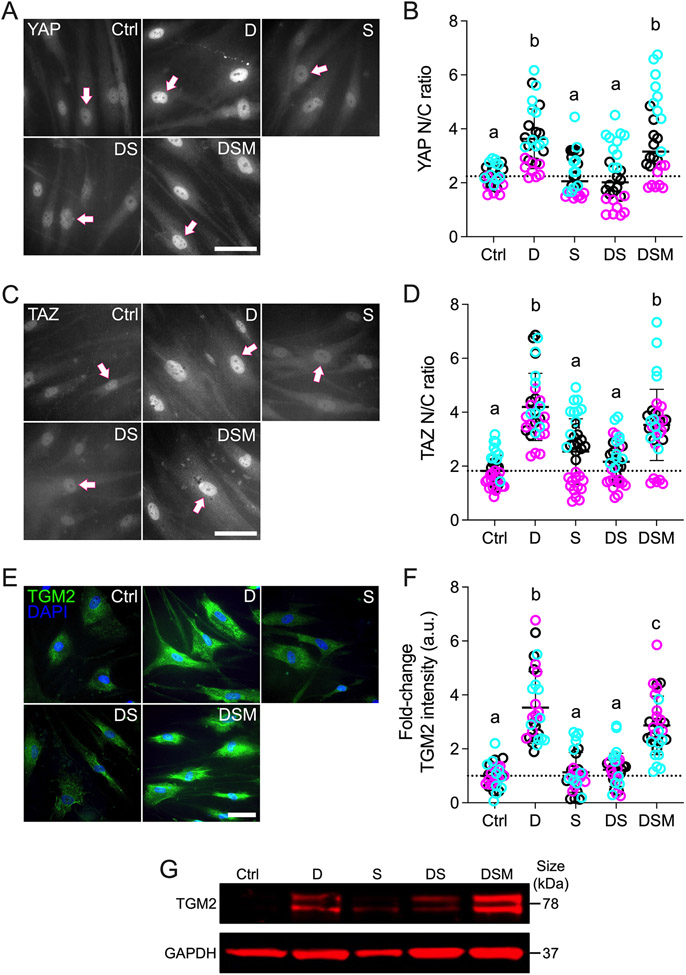
Fig. 1. Effects of simvastatin on YAP/TAZ nuclear localization and TGM2 levels in HTM cells.
(A,C,E) Representative fluorescence micrographs of YAP, TAZ, and TGM2 in HTM cells cultured atop ECM hydrogels subjected to vehicle control, dexamethasone (D; 100 nM), simvastatin (S; 10 μM), dexamethasone + simvastatin, and dexamethasone + simvastatin + mevalonate-5-phosphate (M; 500 μM) at 3 d. Arrows indicate YAP/TAZ nuclear localization. Scale bar, 20 μm. (B,D,F) Analysis of YAP/TAZ nuclear/cytoplasmic ratios and TGM2 fluorescence intensity (N = 27-34 images from 3 HTM cell strains with 3 experimental replicates per cell strain). Symbols with different colors represent different cell strains; dotted lines indicate control baselines. The bars and error bars indicate Mean ± SD. Significance was determined by two-way ANOVA using multiple comparisons tests; shared significance indicator letters = non-significant difference (p>0.05), distinct letters = significant difference (p<0.05). (G) Qualitative immunoblot of TGM2 with GAPDH serving as loading control (N = 1 per group [pooled from 3 experimental replicates] from 1 HTM cell strain).

