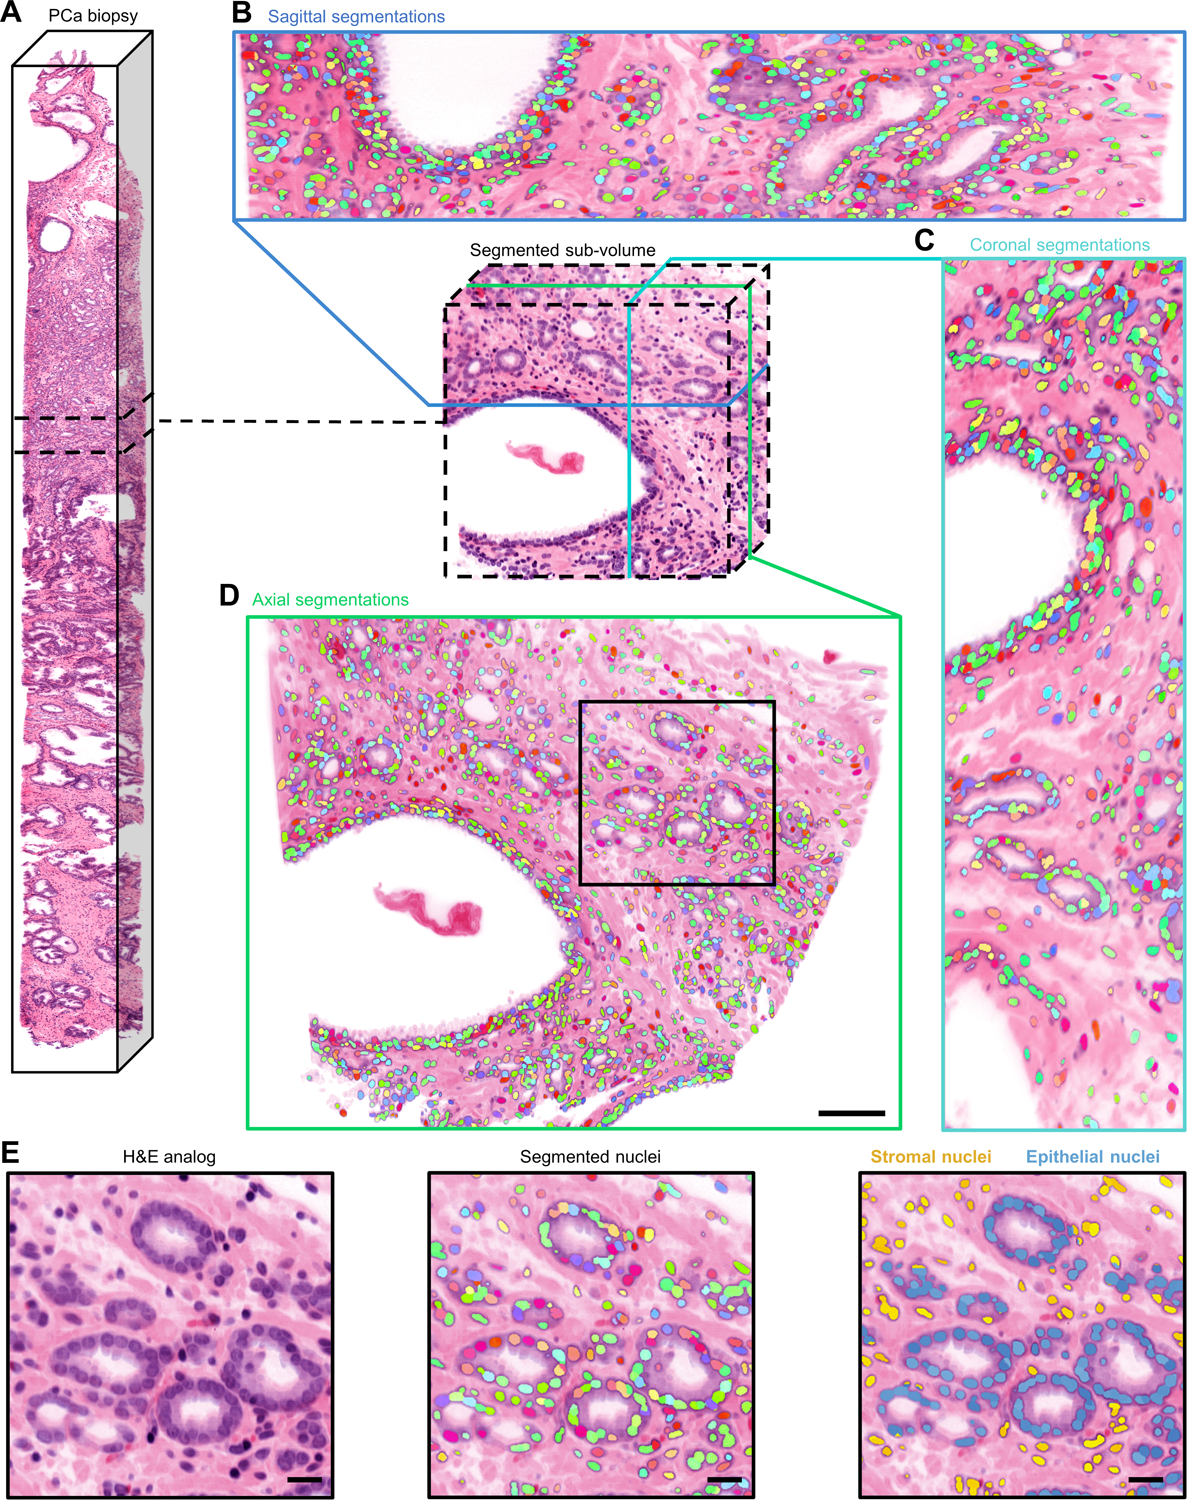
Figure 3. Image atlas of 3D nuclear segmentation results.

(A) Non-destructive 3D pathology dataset of a PCa biopsy and segmented sub-volume. Sagittal (B), coronal (C), and axial (D) views of 3D nuclear segmentations of the segmented sub-volume. During segmentation, each identified nucleus is given a unique integer label, which is represented by a color for visualization purposes (scale bar, 100 μm). (E) Larger field of view showing cancerous glands and surrounding stroma (left). colorized segmentation masks overlaid onto H&E false-colored OTLS images (middle). Segmented nuclei colored by their location within the prostate microarchitecture (right) (scale bar, 50 μm).
