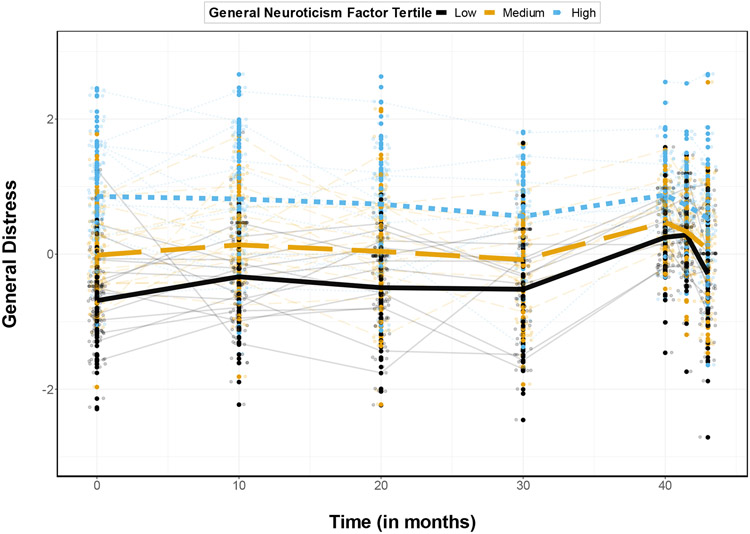
Figure 3. General Distress Trajectories by General Neuroticism Factor Tertile.
Note. To create this figure, participants were separated into tertiles based on their baseline General Neuroticism Factor scores (analyses treated General Neuroticism Factor scores as a continuous variable). Bolded lines reflect the mean observed trajectories of each dimension by General Neuroticism Factor tertile. The smaller, fainter lines (also called spaghetti plot “strands”) show observed change in a randomly selected sub-sample of 60 participants.

