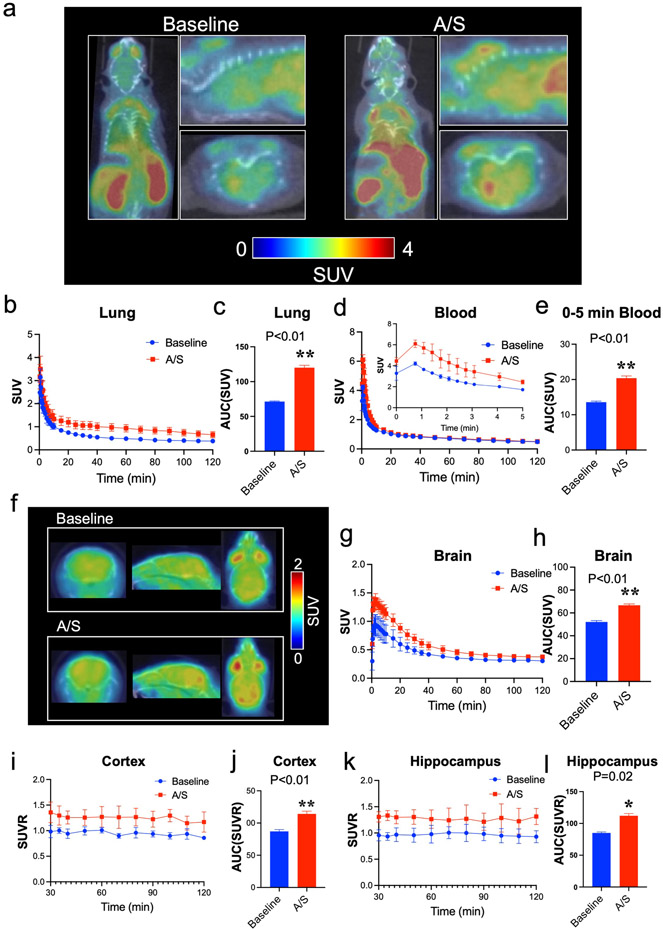
Fig. 1. PET study of A/S-induced increases in Tau-PT217 amounts in lungs, blood, and brain of mice.
a. Representative PET images of [18F]Flortaucipir focus on the whole body of the mouse for up to 120 minutes. Time-activity curves of [18F]Flortaucipir in the lungs (b and c) and blood (d and e) show significant differences in the distribution of [18F]Flortaucipir in lungs and blood between the time before A/S (baseline) and the time after A/S in the mice. f. Representative PET images of [18F]Flortaucipir focus on the mouse brain tissues (0-120 minutes; axial, sagittal, and coronal). Time-activity curves of [18F]Flortaucipir in the whole brain (g and h) between baseline and A/S in the mice. Standardized uptake value ratio (SUVR) of [18F]Flortaucipir in the cortex (i and j) and hippocampus (k and l), showing a significant difference of [18F]Flortaucipir brain uptake between baseline and A/S in the mice. Cerebellar gray matter was used as a reference region to yield SUVR for [18F]Flortaucipir. N = 4 mice in each group. Student’s t-test was used to analyze the data presented in c, e, h, j, and i. The P values refer to the difference of [18F]Flortaucipir uptake between the baseline and the A/S in the mice. Error bar indicates standard deviation. PET, positron emission tomography; A/S, anesthesia/surgery; Tau-PT217, Tau phosphorylated at threonine 217; TACs, time activity curves; AUC, area under each TAC; SUV, standardized uptake value; SUVR, standardized uptake value ratio.

