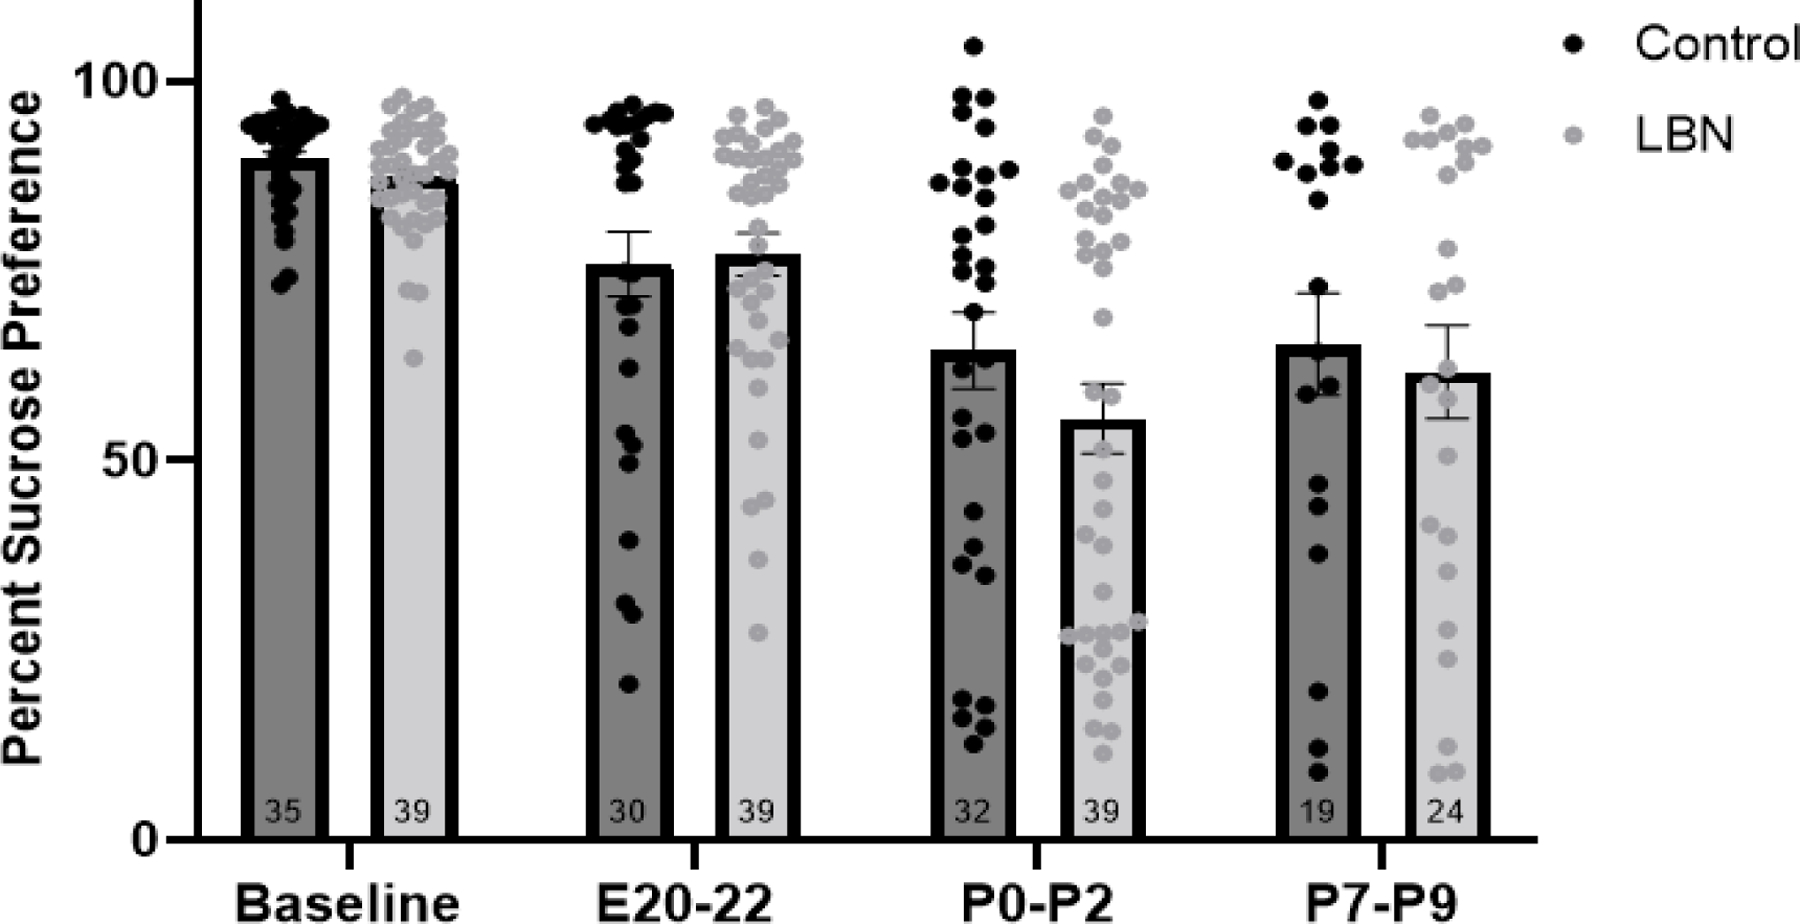
Figure 2. Sucrose Preference in LBN and Control dams at baseline, E20–22, P0–2 and P7–9.

Analysis revealed a decrease in sucrose preference from baseline to P0–2 and P7–9. N/group is listed within the bar. (Baseline-P2: LBN N=24, Control N=21; P7–9: LBN N=11, Control N=9). Error bars represent standard error of the mean (SEM).
