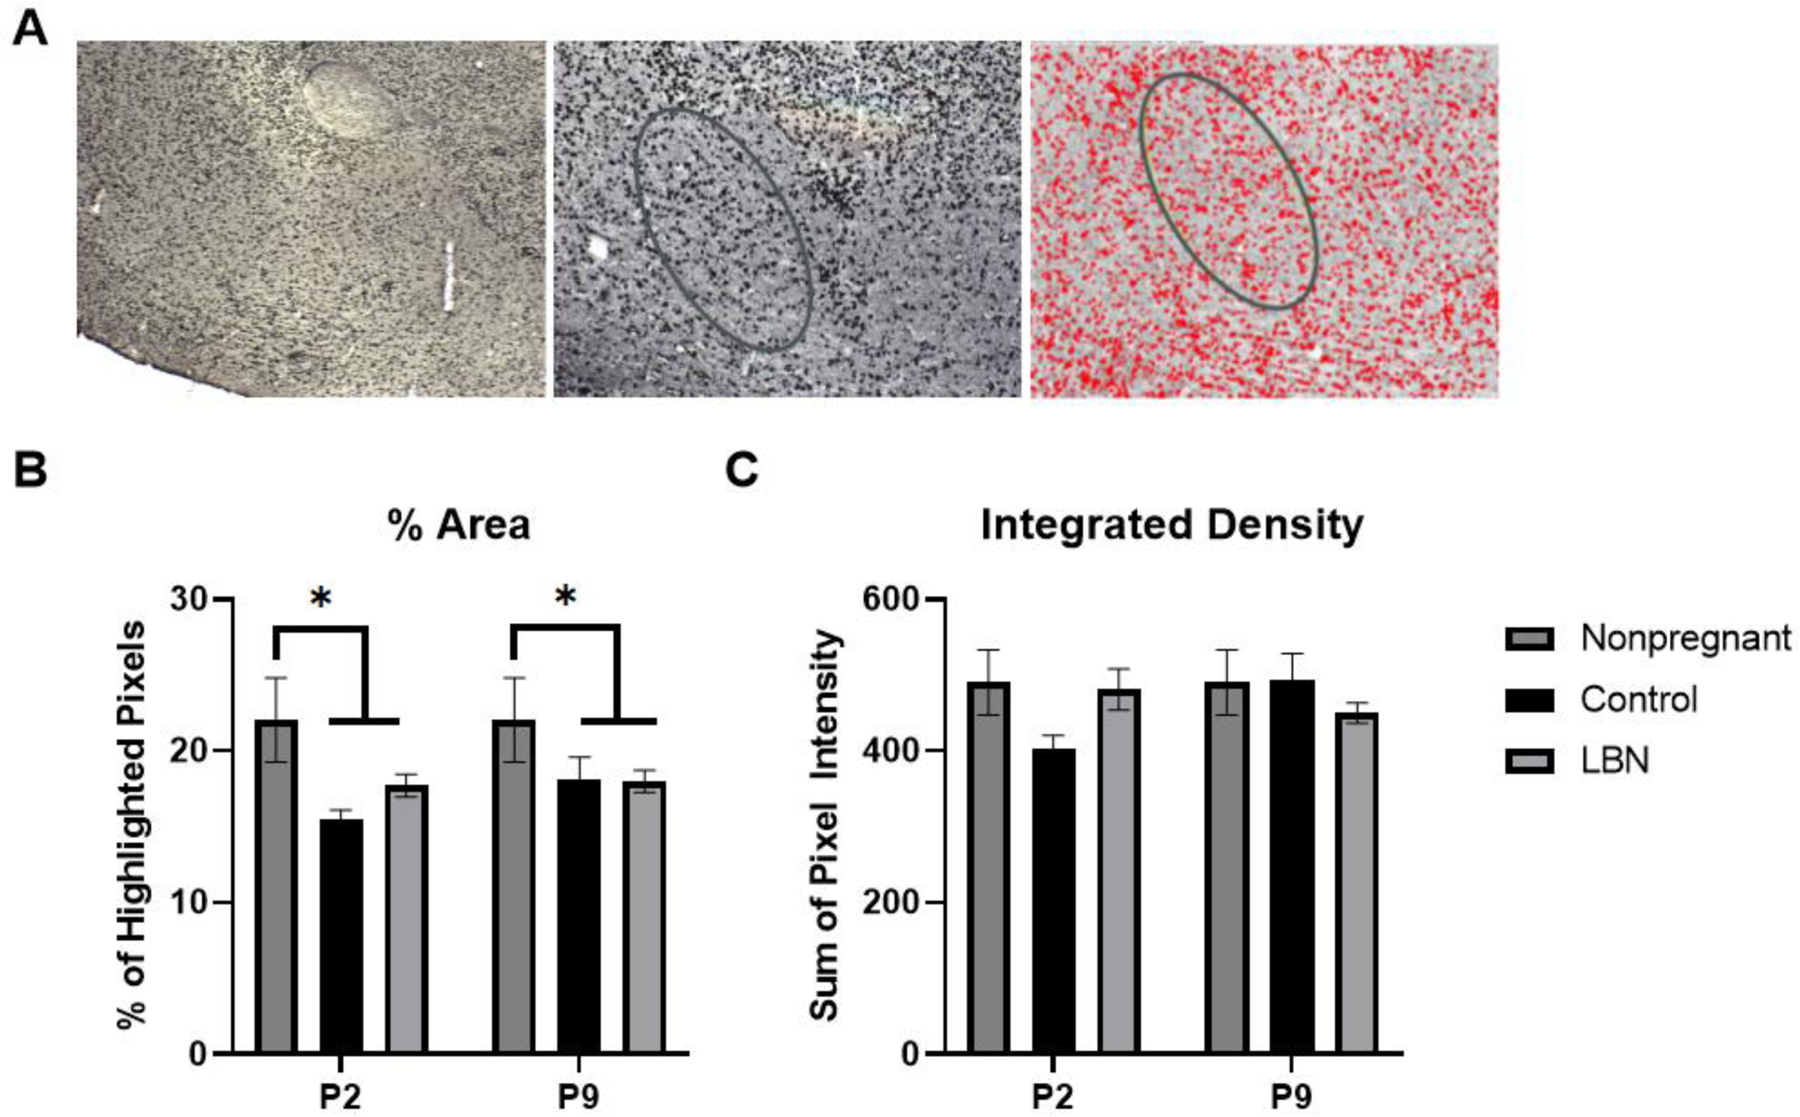
Figure 9. A. Sample images of MPOA and selection area for densitometry analysis in ImageJ.

Image 1: 10x microscope image, Image 2: greyscale image created on ImageJ with MPOA region of interest outlined, image 3: image of highlighted cells after threshold and densitometry applied. B. % Area of highlighted ER-α cells within the selected region of interest inside the MPOA. A main effect of condition revealed that the animals of the postpartum conditions (LBN and Control) expressed a significant decrease in the fraction of highlighted pixels within the region of interest in the MPOA (F(2,36) = 6.188, p = 0.0049; *p < 0.05 relative to non-pregnant females at both time points examined). 5–8 sections were analyzed for non-pregnant control (n=5), P2 controls (n=8), P2 LBN (n=10), P9 controls (n=8), P9 LBN (n=6). C. Integrated density of the pixels within the selected region of interest. No main effects were found. * indicate p < 0.05. Error bars represent standard error of the mean (SEM).
