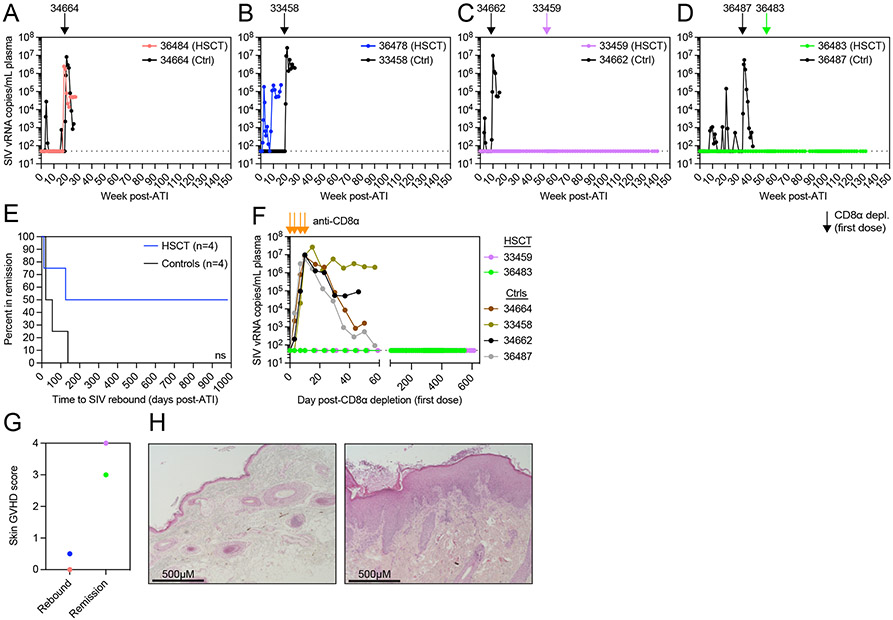
Figure 5. Long-term ART-free SIV remission despite CD8α+ cell depletion in two alloHSCT recipients.
(A-D) SIVmac239 plasma viral loads after ATI. Arrows indicate the first dose of anti-CD8α depleting antibody for alloHSCT recipients (colored) and time-matched controls (black) from Figure 1. Black dotted horizontal lines in A-D,F indicate the LOQ (50 copies/mL). Undetectable values are graphed at the LOQ. (E) Kaplan-Meier curve of time in remission. ns = not significantly different by Log-rank (Mantel-Cox) test. (F) SIVmac239 plasma viral loads during period of CD8α+ cell depletion. Orange arrows indicate doses of anti-CD8α depleting antibody. (G) Skin biopsy GVHD histopathology scores for HSCT recipients that rebounded after ATI or remain in SIV remission. Symbol colors correspond to recipients shown in A. (H) Representative images of hematoxylin and eosin stained tissue sections from HSCT recipient skin biopsies scored in Figure 5G. 36478 (left) shows minimal findings, GVHD score = 0.5. 33459 (right) shows hyperkeratosis and epidermal hyperplasia with mononuclear cell infiltrate, GVHD score = 4. Images taken with 10X objective lens (total 100X magnification). See also figure S5.

