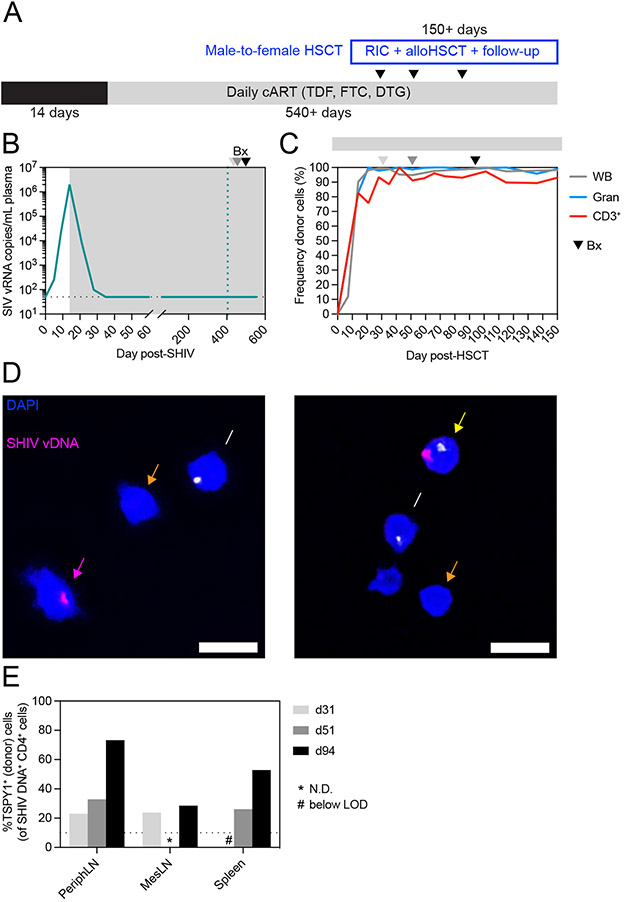
Figure 7. Virus spreads to donor CD4+ T cells despite ART.
(A) Study outline for a female HSCT recipient macaque (38142) transplanted with cells from a male donor. RIC = reduced intensity conditioning. (B) Longitudinal SHIV-AD8-EOM plasma viral loads from HSCT recipient 38142. Gray box denotes ART treatment. Colored dotted vertical line indicates the day of alloHSCT. Arrowheads in B-C denote biopsy timepoints. Black dotted horizontal line indicates LOQ (50 copies/mL). Undetectable values are graphed at the LOQ. (C) Longitudinal donor chimerism in whole blood, blood granulocytes (Gran), and blood T cells (CD3+) in HSCT recipient 38142. Gray bar above the graph denotes ART treatment. (D) Representative images from DNAscope cytospin assay of peripheral LN CD4+ cells from HSCT recipient 38142 at day 51 post-HSCT. Yellow arrow indicates an infected (male) donor cell (TSPY1+SHIV+), pink arrow indicates an infected (female) recipient cell (TSPY1−SHIV+), white arrow indicates an uninfected (male) donor cell (TSPY1+SHIV−), and orange arrow indicates an uninfected (female) recipient cell (TSPY1−SHIV−). (E) Frequency of SHIV DNA+ cells that are TSPY1+ (male). Asterisks (*) indicate measurements not determined due to insufficient cell numbers. Hashtags (#) indicate measurements below the limit of detection. See also figure S1, S2, S7.

