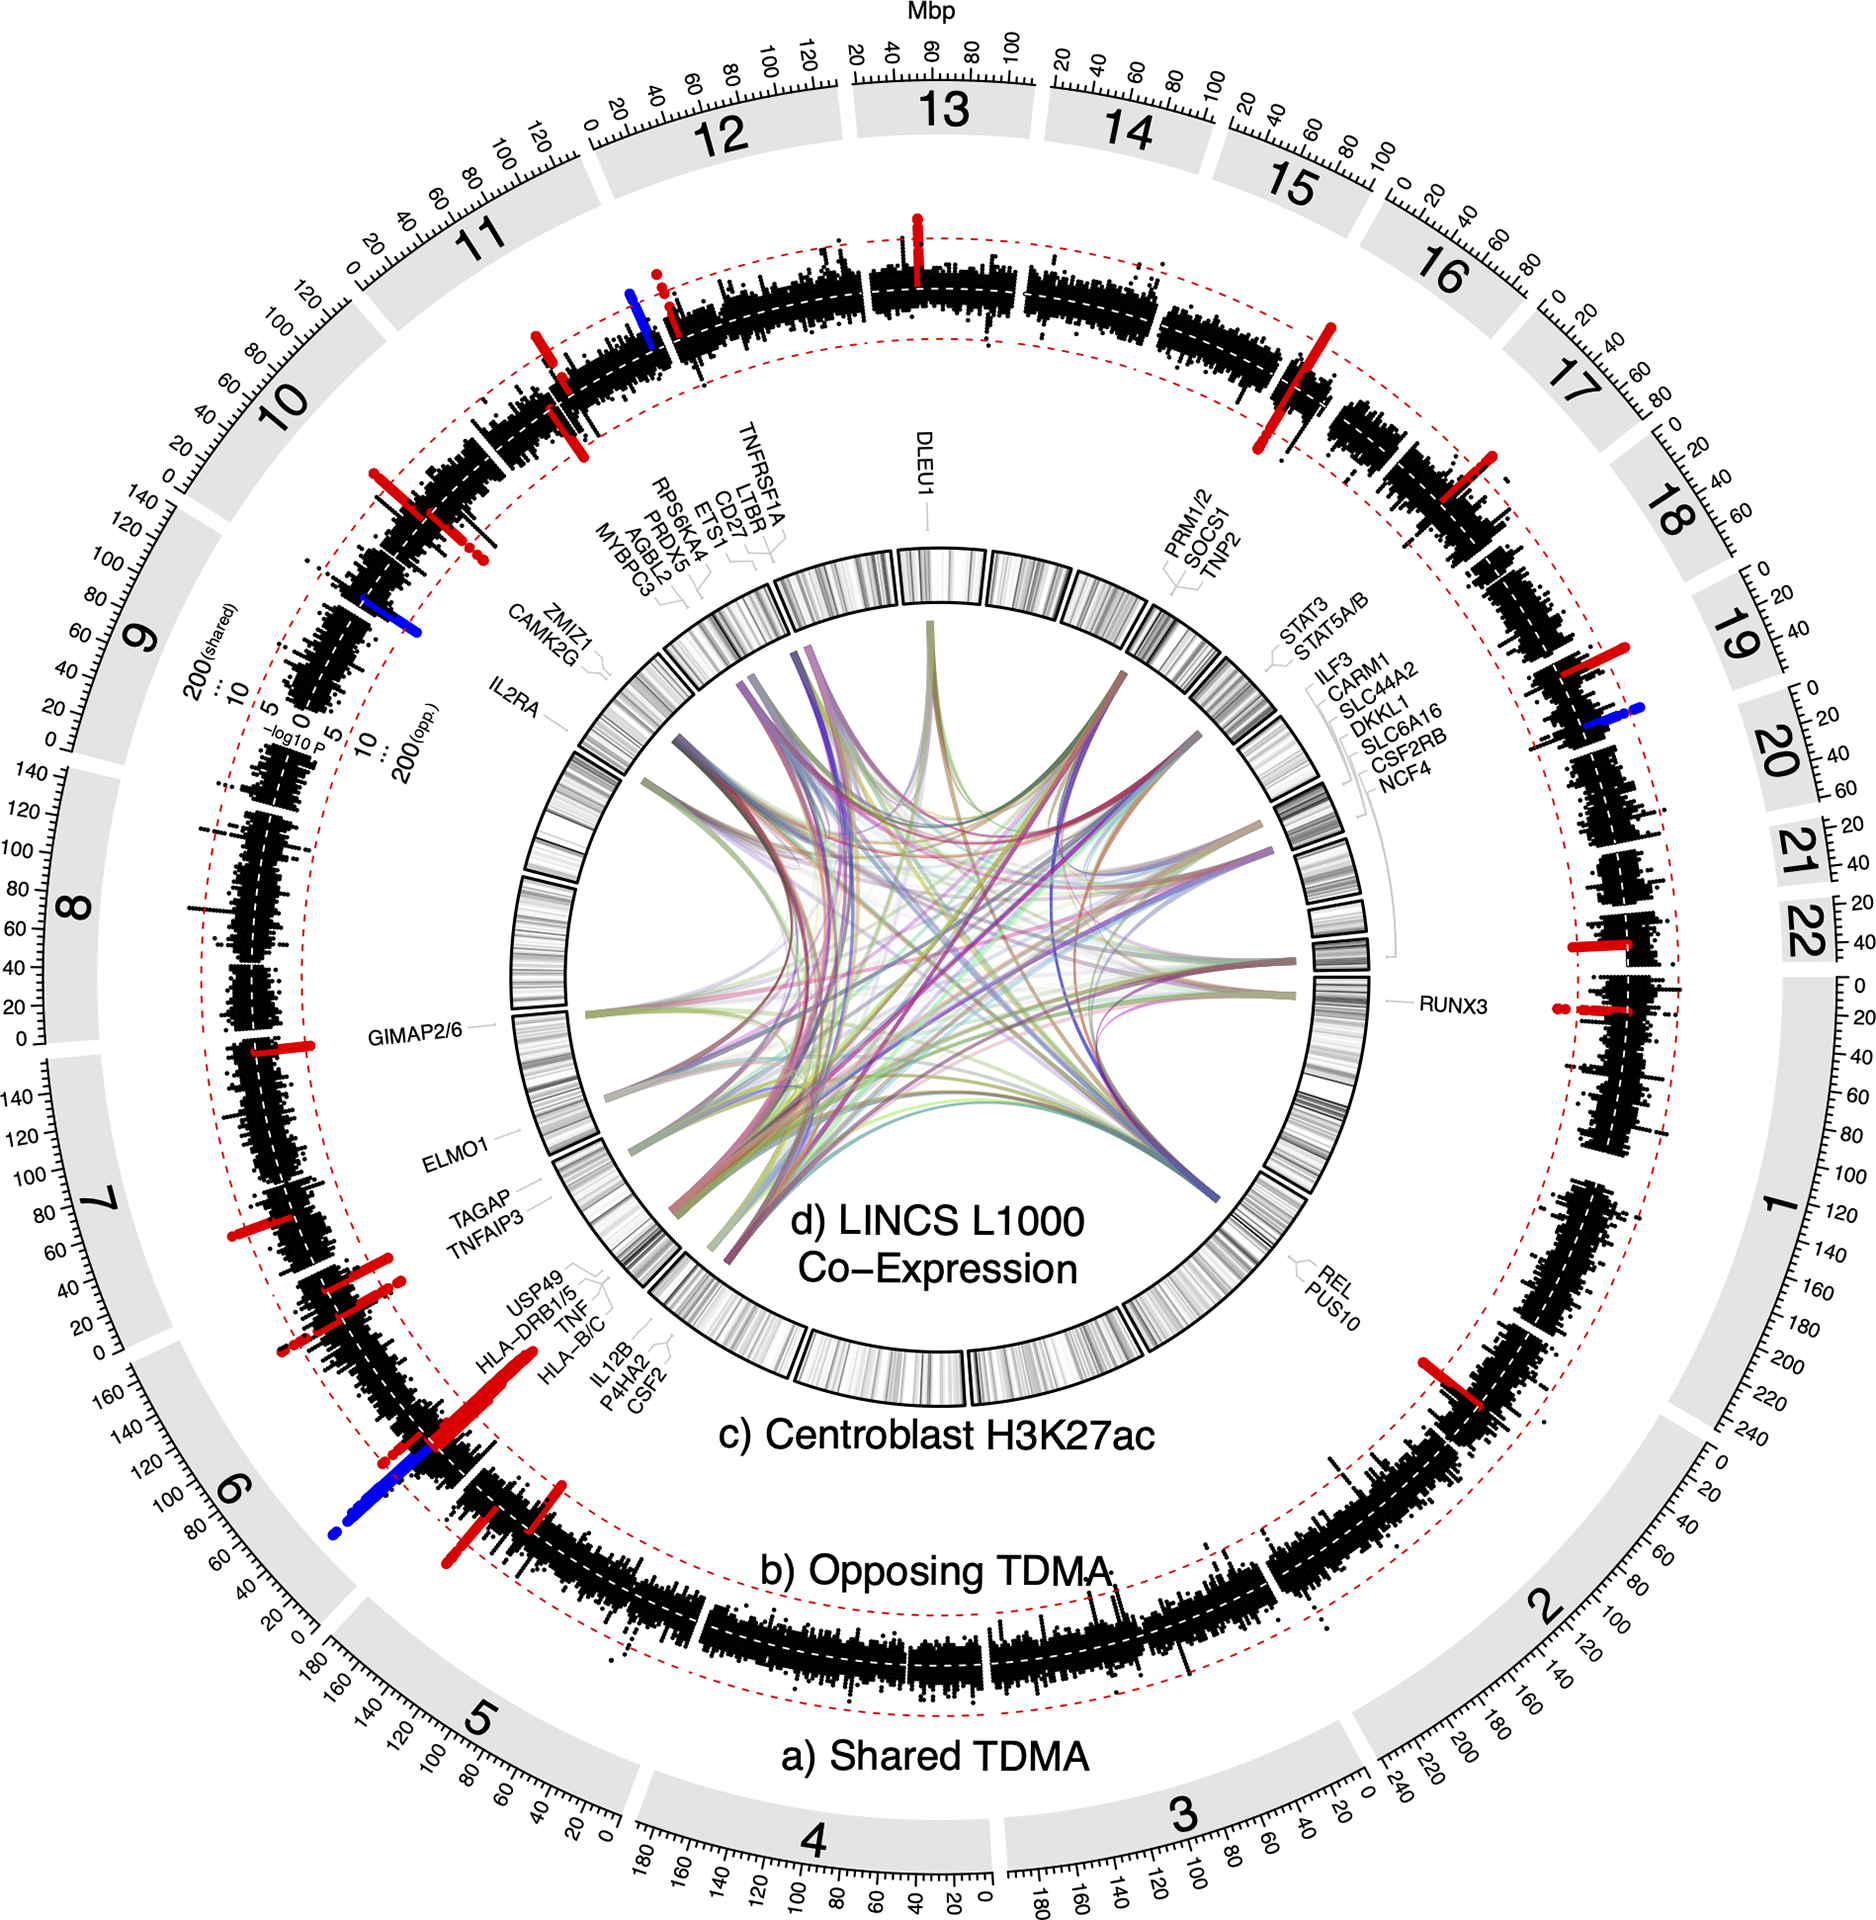
Figure 1: IVW trans-disease meta-analysis (TDMA).

Circular diagram including the following: a) Manhattan plot of shared (same direction of effect) psoriasis/MS TDMA signals, showing markers more significant in TDMA than for either trait. b) Manhattan plot of opposing (opposite direction of effect) psoriasis/MS trans-disease meta-analysis (TDMA) signals, showing markers more significant in TDMA than for either trait. Red dashed lines indicate the genome-wide significance (p<5×10⁻⁸) threshold for shared and opposing signals, respectively. Loci which meet this threshold and are suggestively significant (p<1×10⁻⁴) for both traits are highlighted in red (if identified through our original TDMA approach) or blue (for additional loci identified using GCTA-COJO). c) Density of H3K27ac active enhancer marks for B-cell centroblasts (the most enriched cell type among the TDMA loci, compared to other established loci for psoriasis and MS). The darker the color, the higher the proportion of regulatory marks overlapping each 2Mbp region. Genes reported by previous psoriasis and MS GWAS1,4,96–99 are labeled for each locus. d) Links between genes, according to co-expression in L1000 assay perturbation experiments from NIH’s Library of Integrated Network-Based Cellular Signatures (LINCS). Each link has a random color, with transparency (alpha) values set proportional to the log-scaled number of experiments in which at least one gene from a locus is co-expressed with at least one gene from another locus, such that more opaque links represent pairs of loci with genes co-expressed in more experiments.
