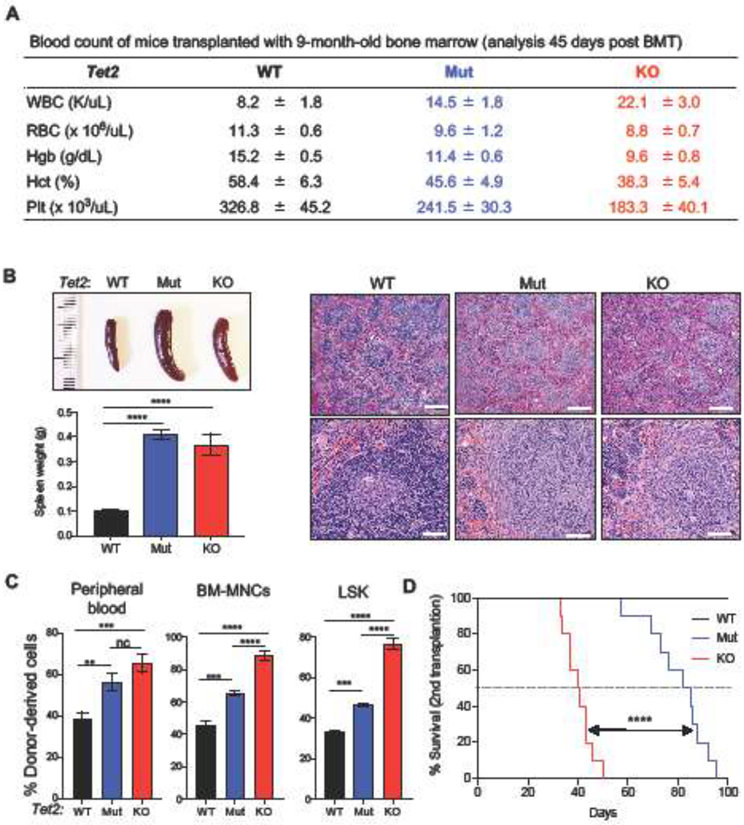
Figure 2. Hematopoietic characterization induced by donor bone marrow cells from 9-month-old Tet2 Mut and KO mice.
A. Blood count of recipient mice transplanted with BM-MNCs from 9-month-old Tet2 Mut and KO donor bone marrow cells 45 days after 1st BMT (n = 5 of each genotype).
B. Representative images and weights (left) and H&E staining (right) of spleens of recipient mice transplanted with 9-month-old Tet2 WT, Mut, or KO BM-MNCs 45 days after 1st BMT. Scale bars= 400 μm (in top three panels) and 60 μm (in bottom three panels).
C. Percent donor-derived cells in peripheral blood (left) and bone marrow (BM-MNCs [middle] and LSK [right]) 45 days after 1st BMT.
D. Kaplan-Meier survival curve of recipient mice upon secondary transplantation (2nd BMT, 10 mice per group). Mice were transplanted with donor bone marrow cells from recipients of 1st transplantation. Log-rank test was used to generate p values.
LSK, Lin−Sca-1+c-Kit+. Error bars indicate SD. n.c. stands for no significant change. *p < 0.05, **p < 0.01, ***p < 0.001, ****p < 0.0001.

