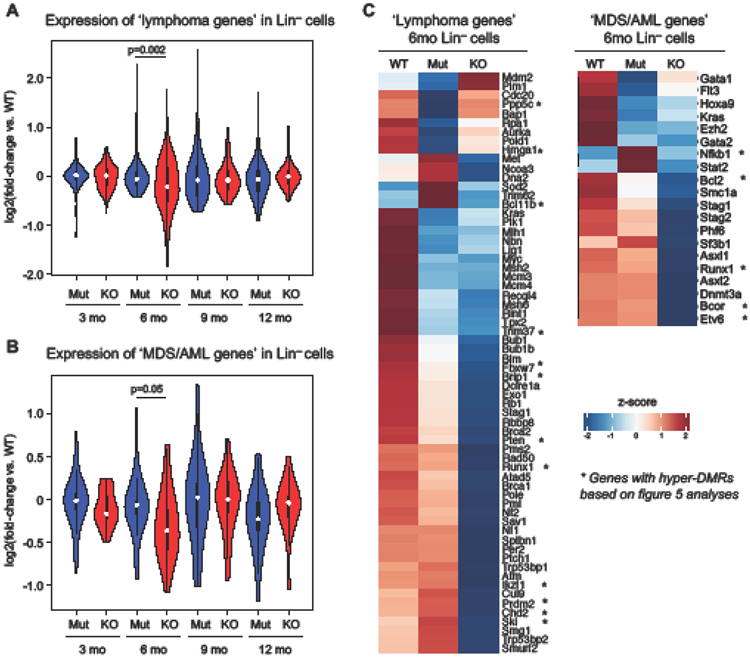
Figure 4: Lymphoma and leukemia genes are downregulated in Tet2 KO Lin− cells.
A. Expression levels of lymphoma signature genes (from GSEA) in Tet2 Mut and KO Lin− cells across time points. Fold-change vs. WT is shown. Welch two sample t-test.
B. Expression levels of selected MDS/AML signature genes (reported as commonly mutated in the literature) in Tet2 Mut and KO Lin− cells across time points. Fold-change vs. WT is shown. Welch two sample t-test.
C. Heatmap showing lymphoma and MDS/AML signature genes downregulated in Tet2 KO Lin− cells at 6 months. Relative expression levels from normalized counts are shown. * indicated genes containing a hyper-DMR (per the analyses in figure 5).

