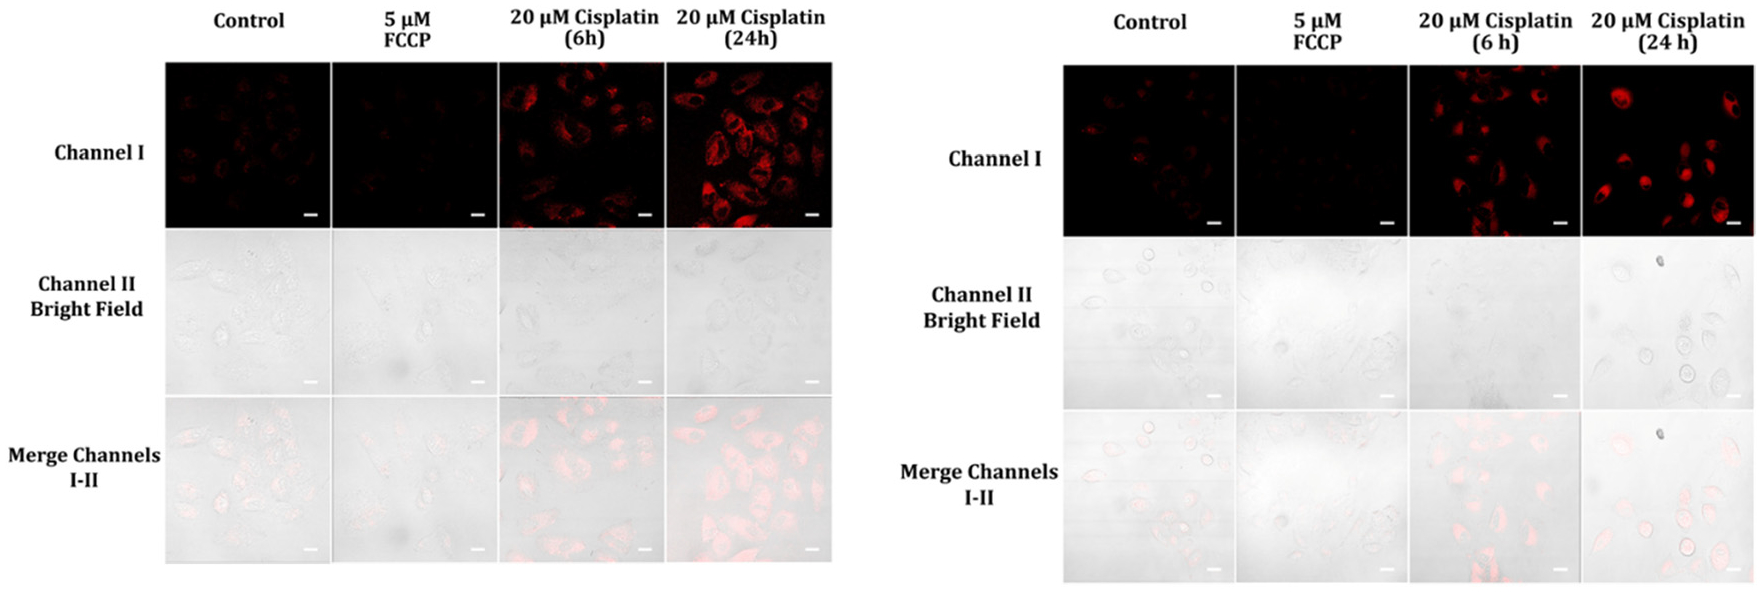
Fig. 12.

Cellular fluorescence images of A459 cells pre-treated with 5 μM FCCP in cell medium for 15 minutes and 20 μM cisplatin in cell medium for 6 and 24 hours, then incubated with 5 μM probes A (left) and B (right) in cell medium for one hour. The cells’ fluorescence was gathered from a 488 nm excitation within a range of 575–675 nm for probe A and 550–650 nm for probe B. Scale bars of the images were 50 μm.
