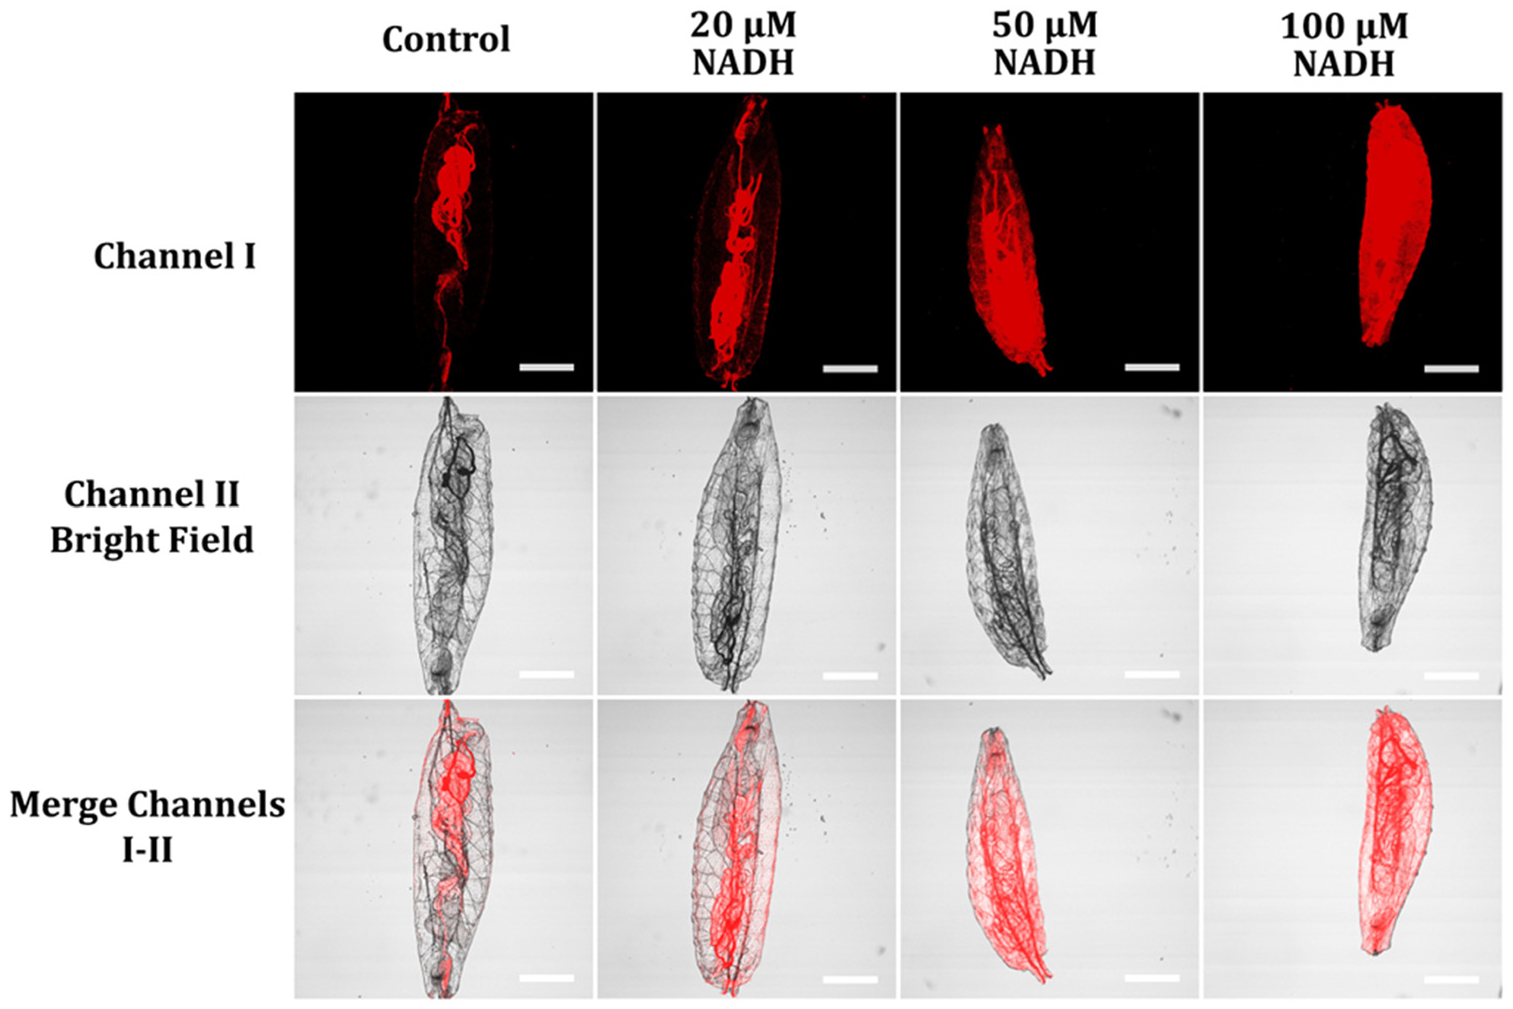
Fig. 14.

Fluorescence images of starvation-hatched D. melanogaster first-instar larvae pre-incubated with various NADH concentrations (0, 20 μM, 50 μM, and 100 μM) for 30 minutes, washed with pH 7.4 PBS buffer thrice, and subsequently treated with 5 μM probe A in an aqueous solution for an hour. The images were obtained by exciting the probes at 488 nm and collecting emission signals ranging from 575 to 675 nm with scale bars of 200 μm.
