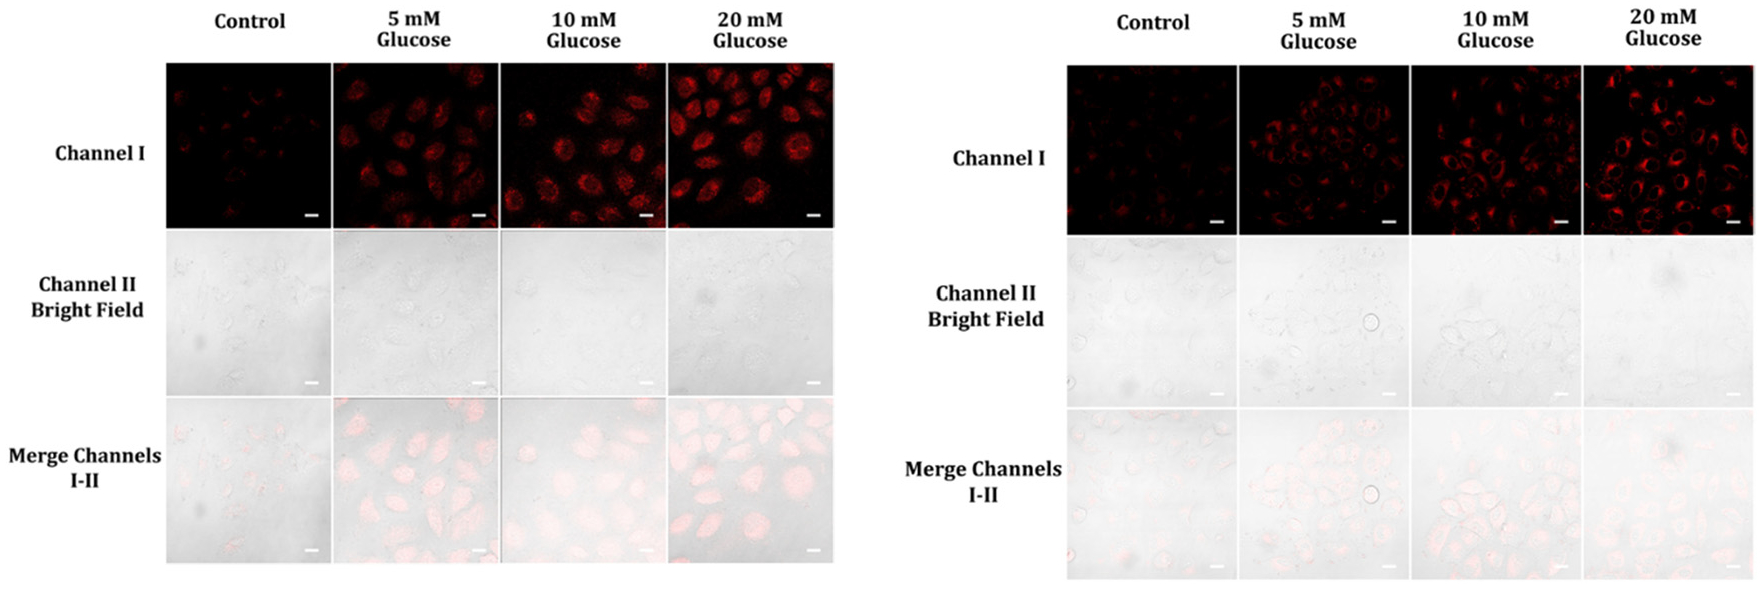
Fig. 8.

Fluorescence images of A459 cells pre-treated with different concentrations of glucose (0, 5, 10, 20 mM) in cell medium for one hour, followed by incubation with 5 μM of either probe A (left) or B (right) in cell medium for an additional hour. The fluorescence images were acquired from 575 nm to 675 nm for probe A and from 550 nm to 650 nm for probe B, with excitation at 488 nm. The scale bars on the images represent 50 μm.
