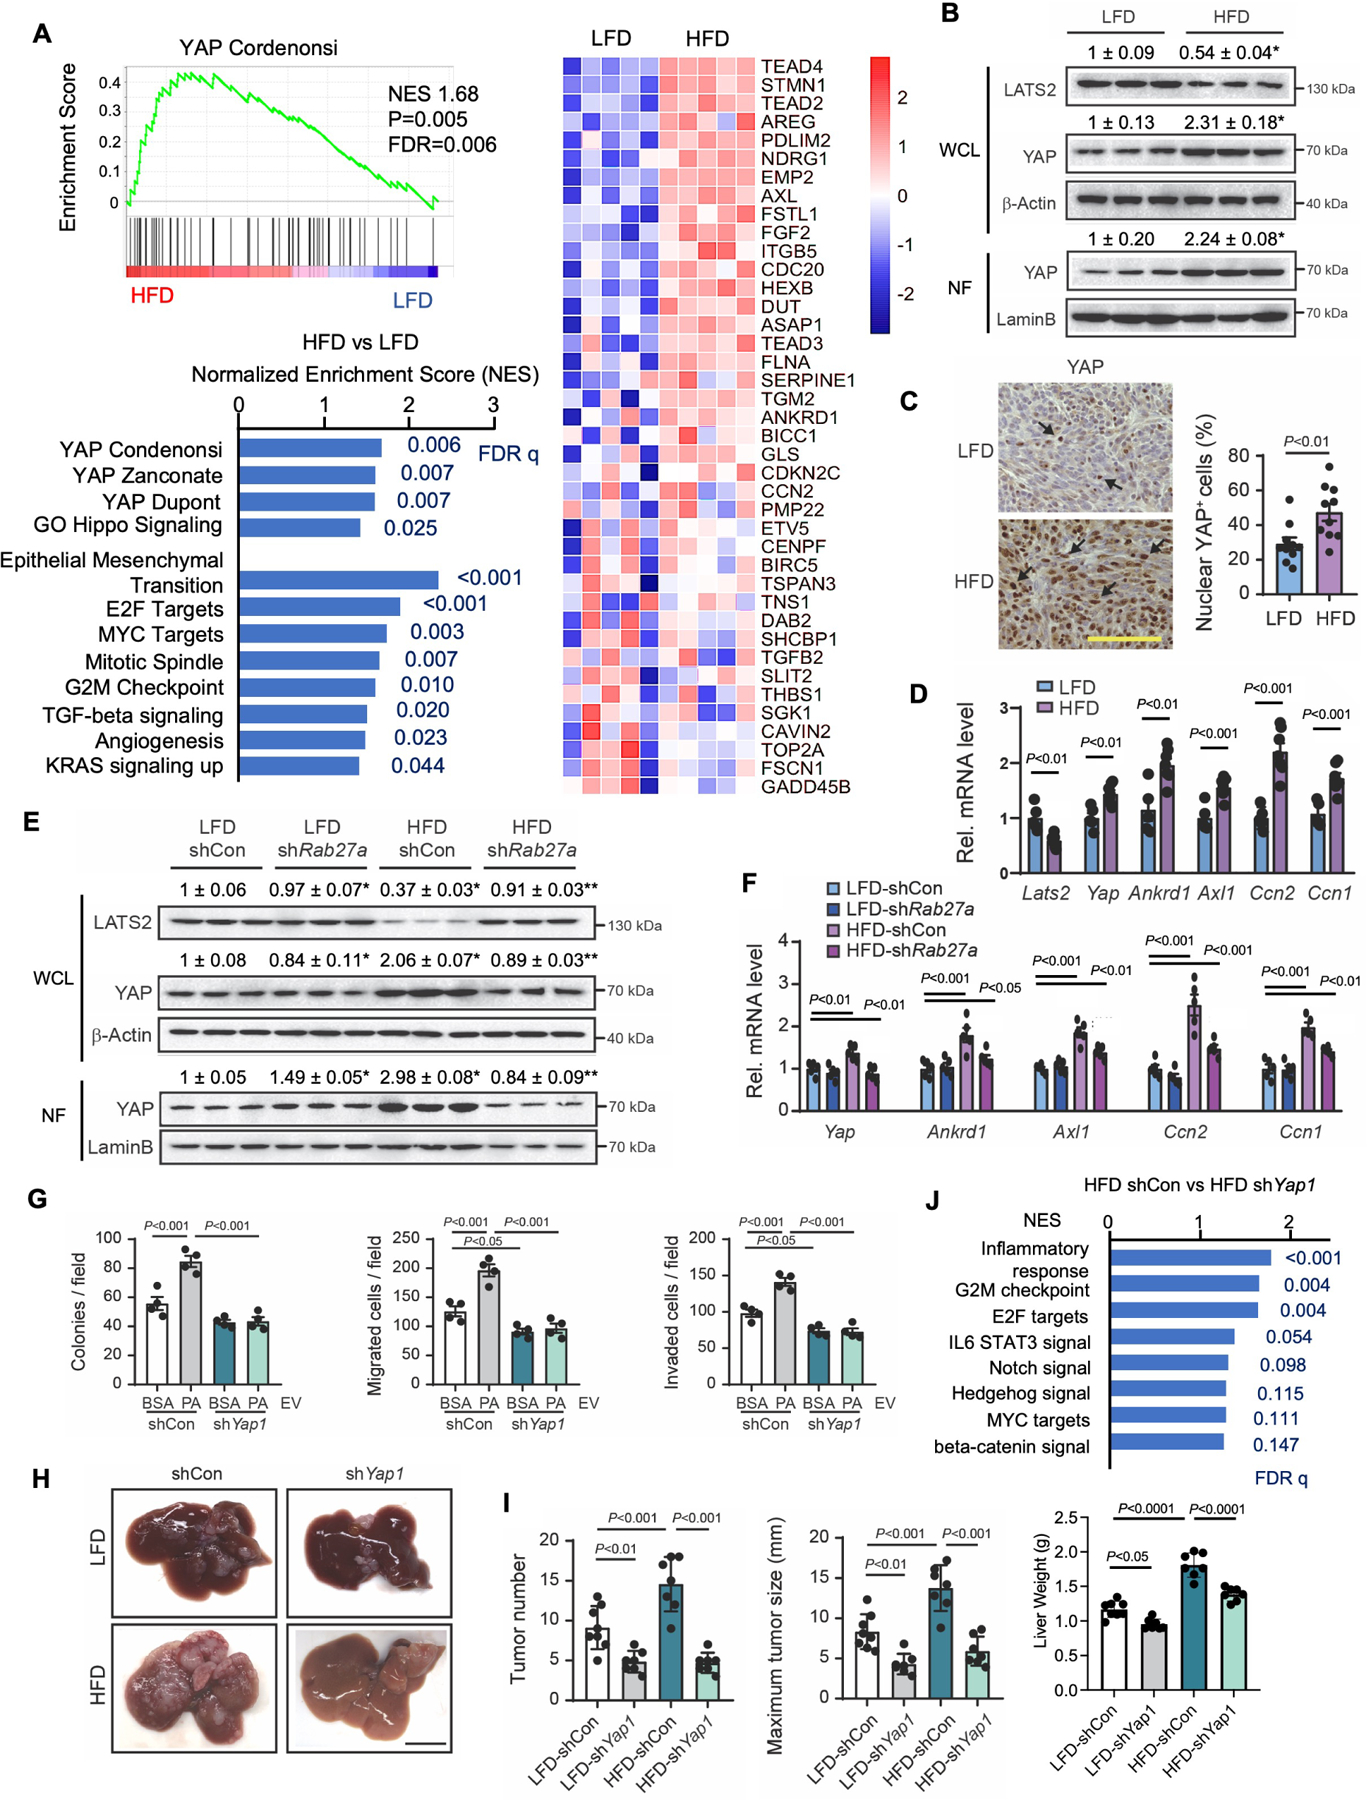
Figure 4. YAP Activity Contributes to Colorectal Cancer Liver Metastasis Enhanced by Non-Alcoholic Fatty Liver Disease.

(A) RNA-seq for tumor samples from Figure 1A (n=5/group). GSEA for YAP target and oncogenic gene sets in tumors from LFD-fed and HFD-fed mice. A heatmap of YAP target genes. NES, normalized enrichment score; FDR, false discovery rate.
(B) Immunoblots and quantification of whole cell lysates (WCL) and nuclear fractions (NF) from tumors in Figure 1A.
(C) Representative images of immunohistochemistry for YAP in metastatic liver tumors in mice fed a LFD or HFD (n=10/group). Quantification of nuclear YAP+ cells. Scale bar, 100 μm.
(D) qRT-PCR assays for Lats2, Yap, and YAP target genes (Ankrd1, Axl1, Ccn2, and Ccn1) in metastatic liver tumors in mice fed a LFD (n=5) or HFD (n=7).
(E) Representative immunoblot images and quantifications for LATS2 and YAP in metastatic tumors. Samples were from Figure 1K. Adenovirus expressing shRab27a or shCon was administered into the tail vein before splenic injection of MC38 cells.
(F) qRT-PCR assays for Yap and its target genes (Ankrd1, Axl1, Ccn2, and Ccn1) in metastatic liver tumors.
(G) The effect of Yap1 knockdown in MC38 cells on colony formation, migration, and invasion (n=4 per group). MC38 cells with shCon or shRNA for Yap1 (shYap1) were treated with EVs from supernatant of vehicle-treated (bovine serum albumin, BSA) or PA-treated PHCs.
(H-J) After 6 weeks of LFD or HFD feeding, MC38 cells with shCon or shYap1 were injected into the spleens of mice (n=7–8/group).
(H) Representative macroscopic images of liver metastases. Scale bar, 1 cm.
(I) Number of tumors, maximum tumor size (mm), and liver weights (g).
(J) GSEA oncogenic gene sets in tumors from control and Yap-silenced tumors.
Data shown as mean ± SEM (C,D,F,G) or mean ± SD (I). Significance determined by two-tailed Student’s t-test (C,D) or oneway ANOVA with Tukey’s post hoc analysis (B, E-G, and I). *P<0.05 versus LFD (B). *P<0.05 versus LFD-shCon; **P<0.01 versus HFD-shCon. (E). N.S., not significant.
See also Figure S4.
