
Figure 7. Increased YAP Activity and Immunosuppressive Tumor Microenvironment in Colorectal Cancer Liver Metastasis Patients with Non-Alcoholic Fatty Liver Disease.
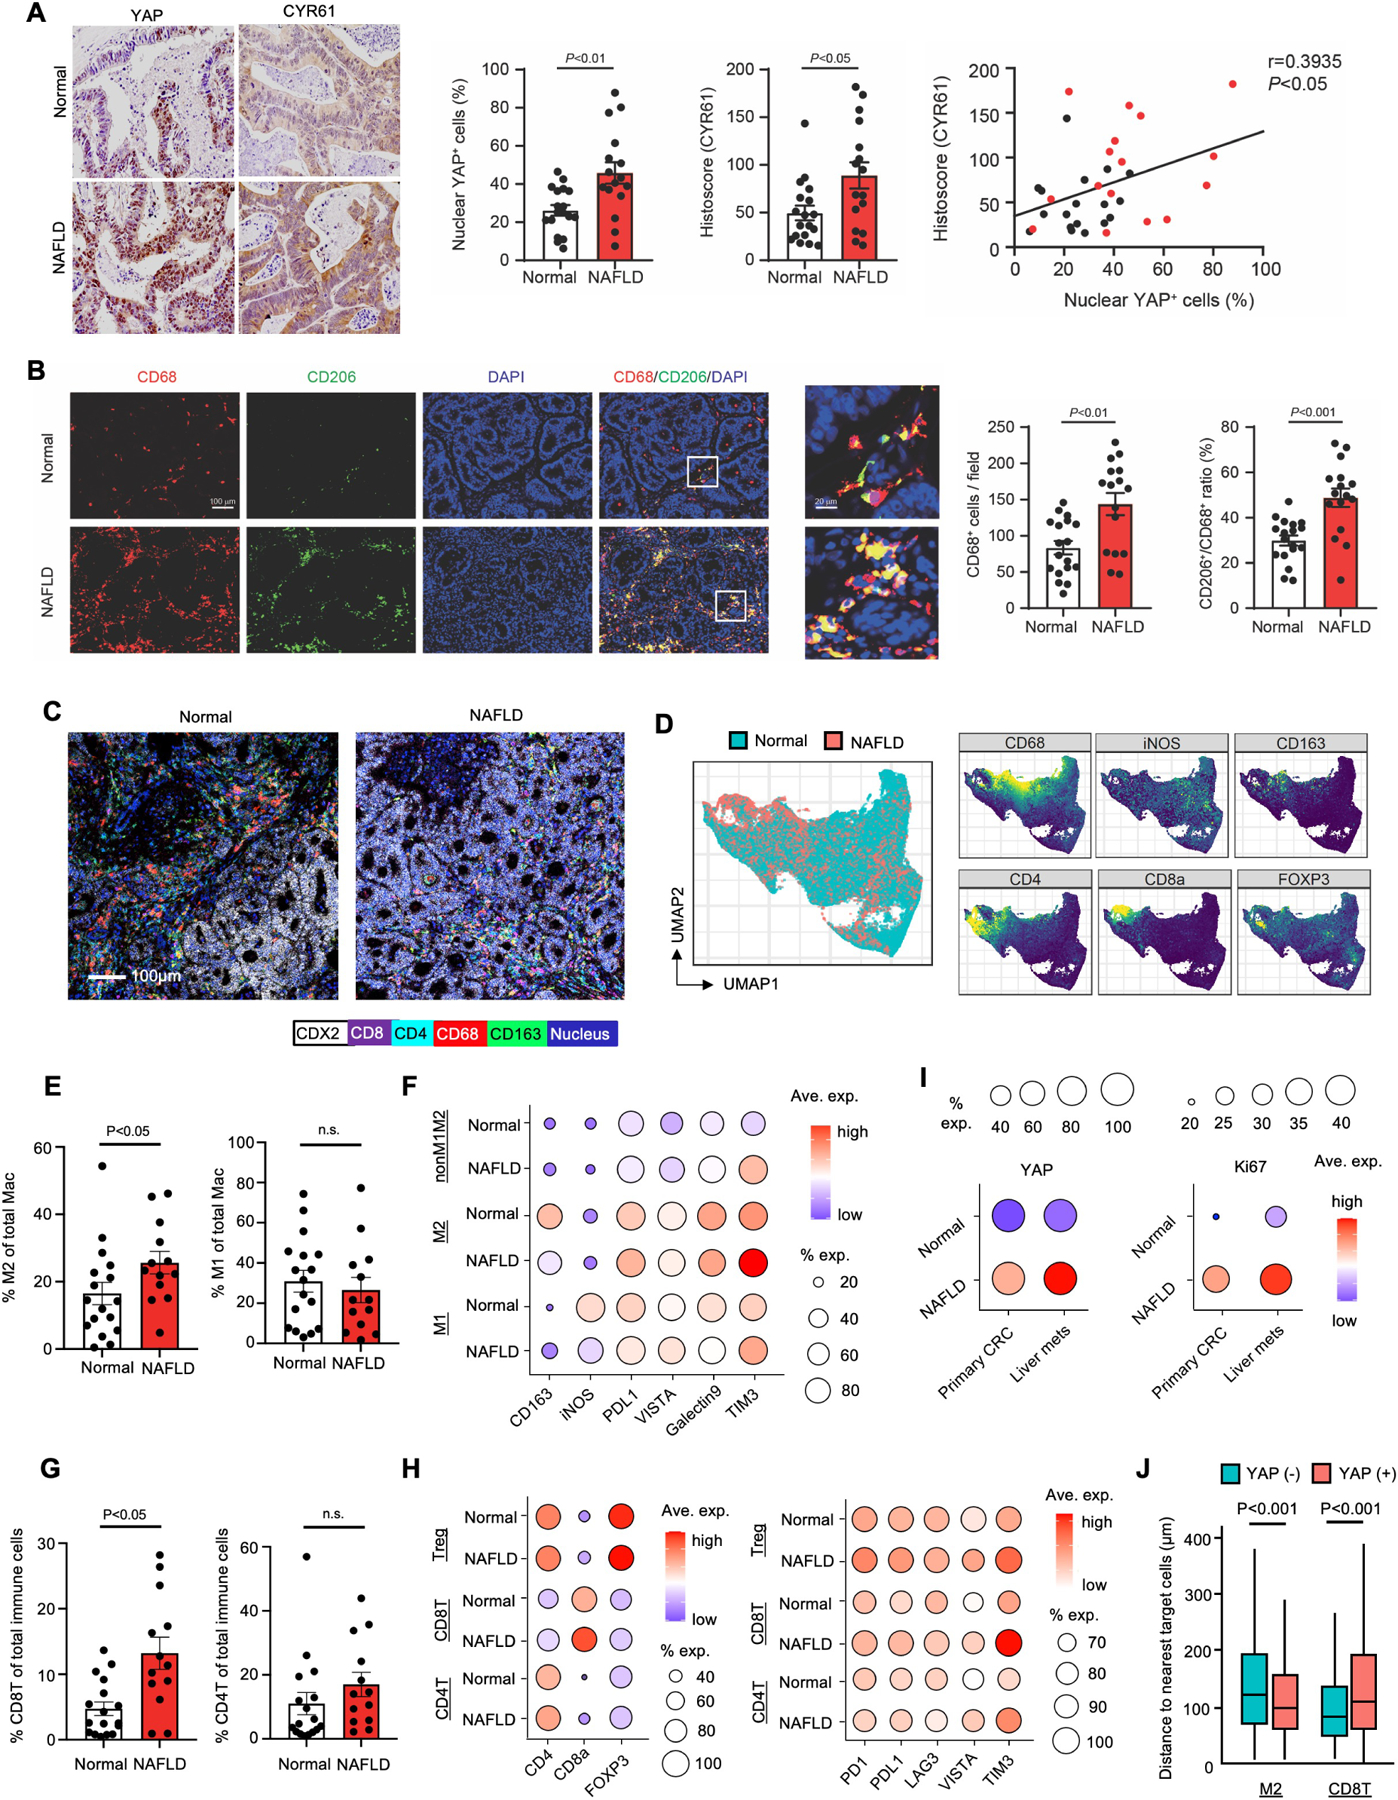
(A) Representative immunohistochemistry images of YAP and CYR61 in metastatic liver tumors of patients with NAFLD (n=16) or without NAFLD (n=18; Normal). Quantification of nuclear YAP+ cells and CYR61-positive areas in human CRC liver metastasis. The correlation between nuclear YAP+ cells and the CYR61-positive areas (right).
(B) Co-localization of CD68 and CD206 in metastatic tumors of patients with NAFLD or without NAFLD (Normal). Representative immunofluorescent images. Quantification of CD68+ cells. Ratio of CD206+/CD68+ cells in human CRC liver metastasis.
(C-H) IMC for TMA comprising CRC liver metastasis patients with NAFLD (n=13) and without NAFLD (n=17; Normal).
(C) Representative IMC images for metastatic liver tumors for CDX2, CD8, CD4, CD68, and CD163 expression.
(D) UMAP of IMC from 147,328 immune cells, colored to distinguish normal and NAFLD conditions (left). UMAPs of expression of CD68, iNOS, CD163, CD8, CD4, and FOXP3 (right).
(E) Quantification of CD163-expressing (M2) and iNOS-expressing (M1) macrophages (Mac).
(F) Dot plot for expression of key cluster-identification and immunomodulatory molecules (columns) by macrophage subpopulations from patients with or without NAFLD (rows). Dot size represents the cell fraction within each cell population. Fill color indicates average expression.
(G) Quantification of CD8 and CD4 T cells.
(H) Dot plot for expression of key cluster-identification and immunomodulatory molecules (columns) by T cell subpopulations in patients with or without NAFLD (rows). Dot size represents the cell fraction within each cell population. Fill color indicates average expression.
(I) Dot plot for YAP and Ki67 expression in primary CRC and metastatic tumors (columns) in patients with or without NAFLD (rows). Dot size represents the cell fraction within each cell population. Fill color indicates average expression.
(J) Spatial analysis of IMC to measure the distances between immune cells (M2 macrophages or CD8 T cells) and metastatic liver tumor cells with and without YAP expression (n=146,429 cells). Data shown as mean ± SEM (A,B,E,G) or mean ± SD (J). Significance determined by two-tailed Student’s t-test (A,B,G,J) or Mann-Whitney U test (E).