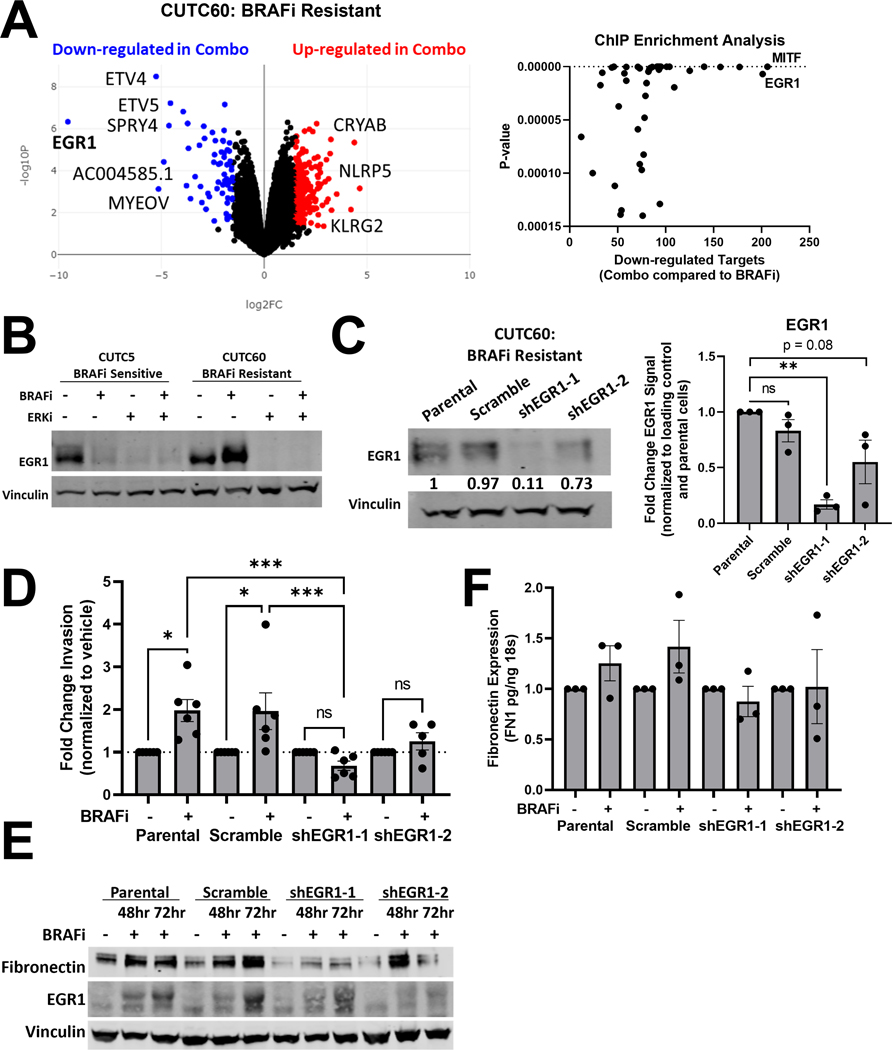
Figure 6: Combined BRAF and ERK1/2 inhibition decreases EGR1 levels and transcriptional targets.
A) RNA-sequencing was performed on CUTC60 cells treated with BRAFi, ERKi or the combination for 48 hrs (Anschutz Medical Campus Functional Genomics Core) and analyzed using BioJupies25 to generate a volcano plot and perform ChIP Enrichment Analysis (CHEA). B) CUTC5 and CUTC60 cells were treated with BRAFi, ERKi or the combination for 48 hrs and western blots were performed for EGR1. C) In CUTC60 cells, EGR1 was knocked down using two shRNAs. Western blots were performed with indicated antibodies. D) CUTC60 parental, scramble, or EGR1 knockdown cells were treated with vehicle or BRAFi for 24 hrs and plated in Matrigel-coated Boyden Chambers. After 24 hrs invading cells were stained with DAPI and counted. E) CUTC60 parental, scramble, or EGR1 knockdown cells were treated with BRAFi for 48 or 72hrs. Indicated proteins were analyzed via western blot. F) CUTC60 parental, scramble, or EGR1 knockdown cells were treated with vehicle or BRAFi for 48 hrs with a serum spike of 10% FBS in the final 1 hr of treatment. Quantitative PCR was performed using primers for FN1. Results displayed as mean normalized to control +/− SEM. *, p < 0.05; **, p < 0.01; ***, p < 0.001; ****, p < 0.0001; ns = not significant BRAFi: 100 nM dabrafenib, ERKi: 1 μM ulixertinib.

