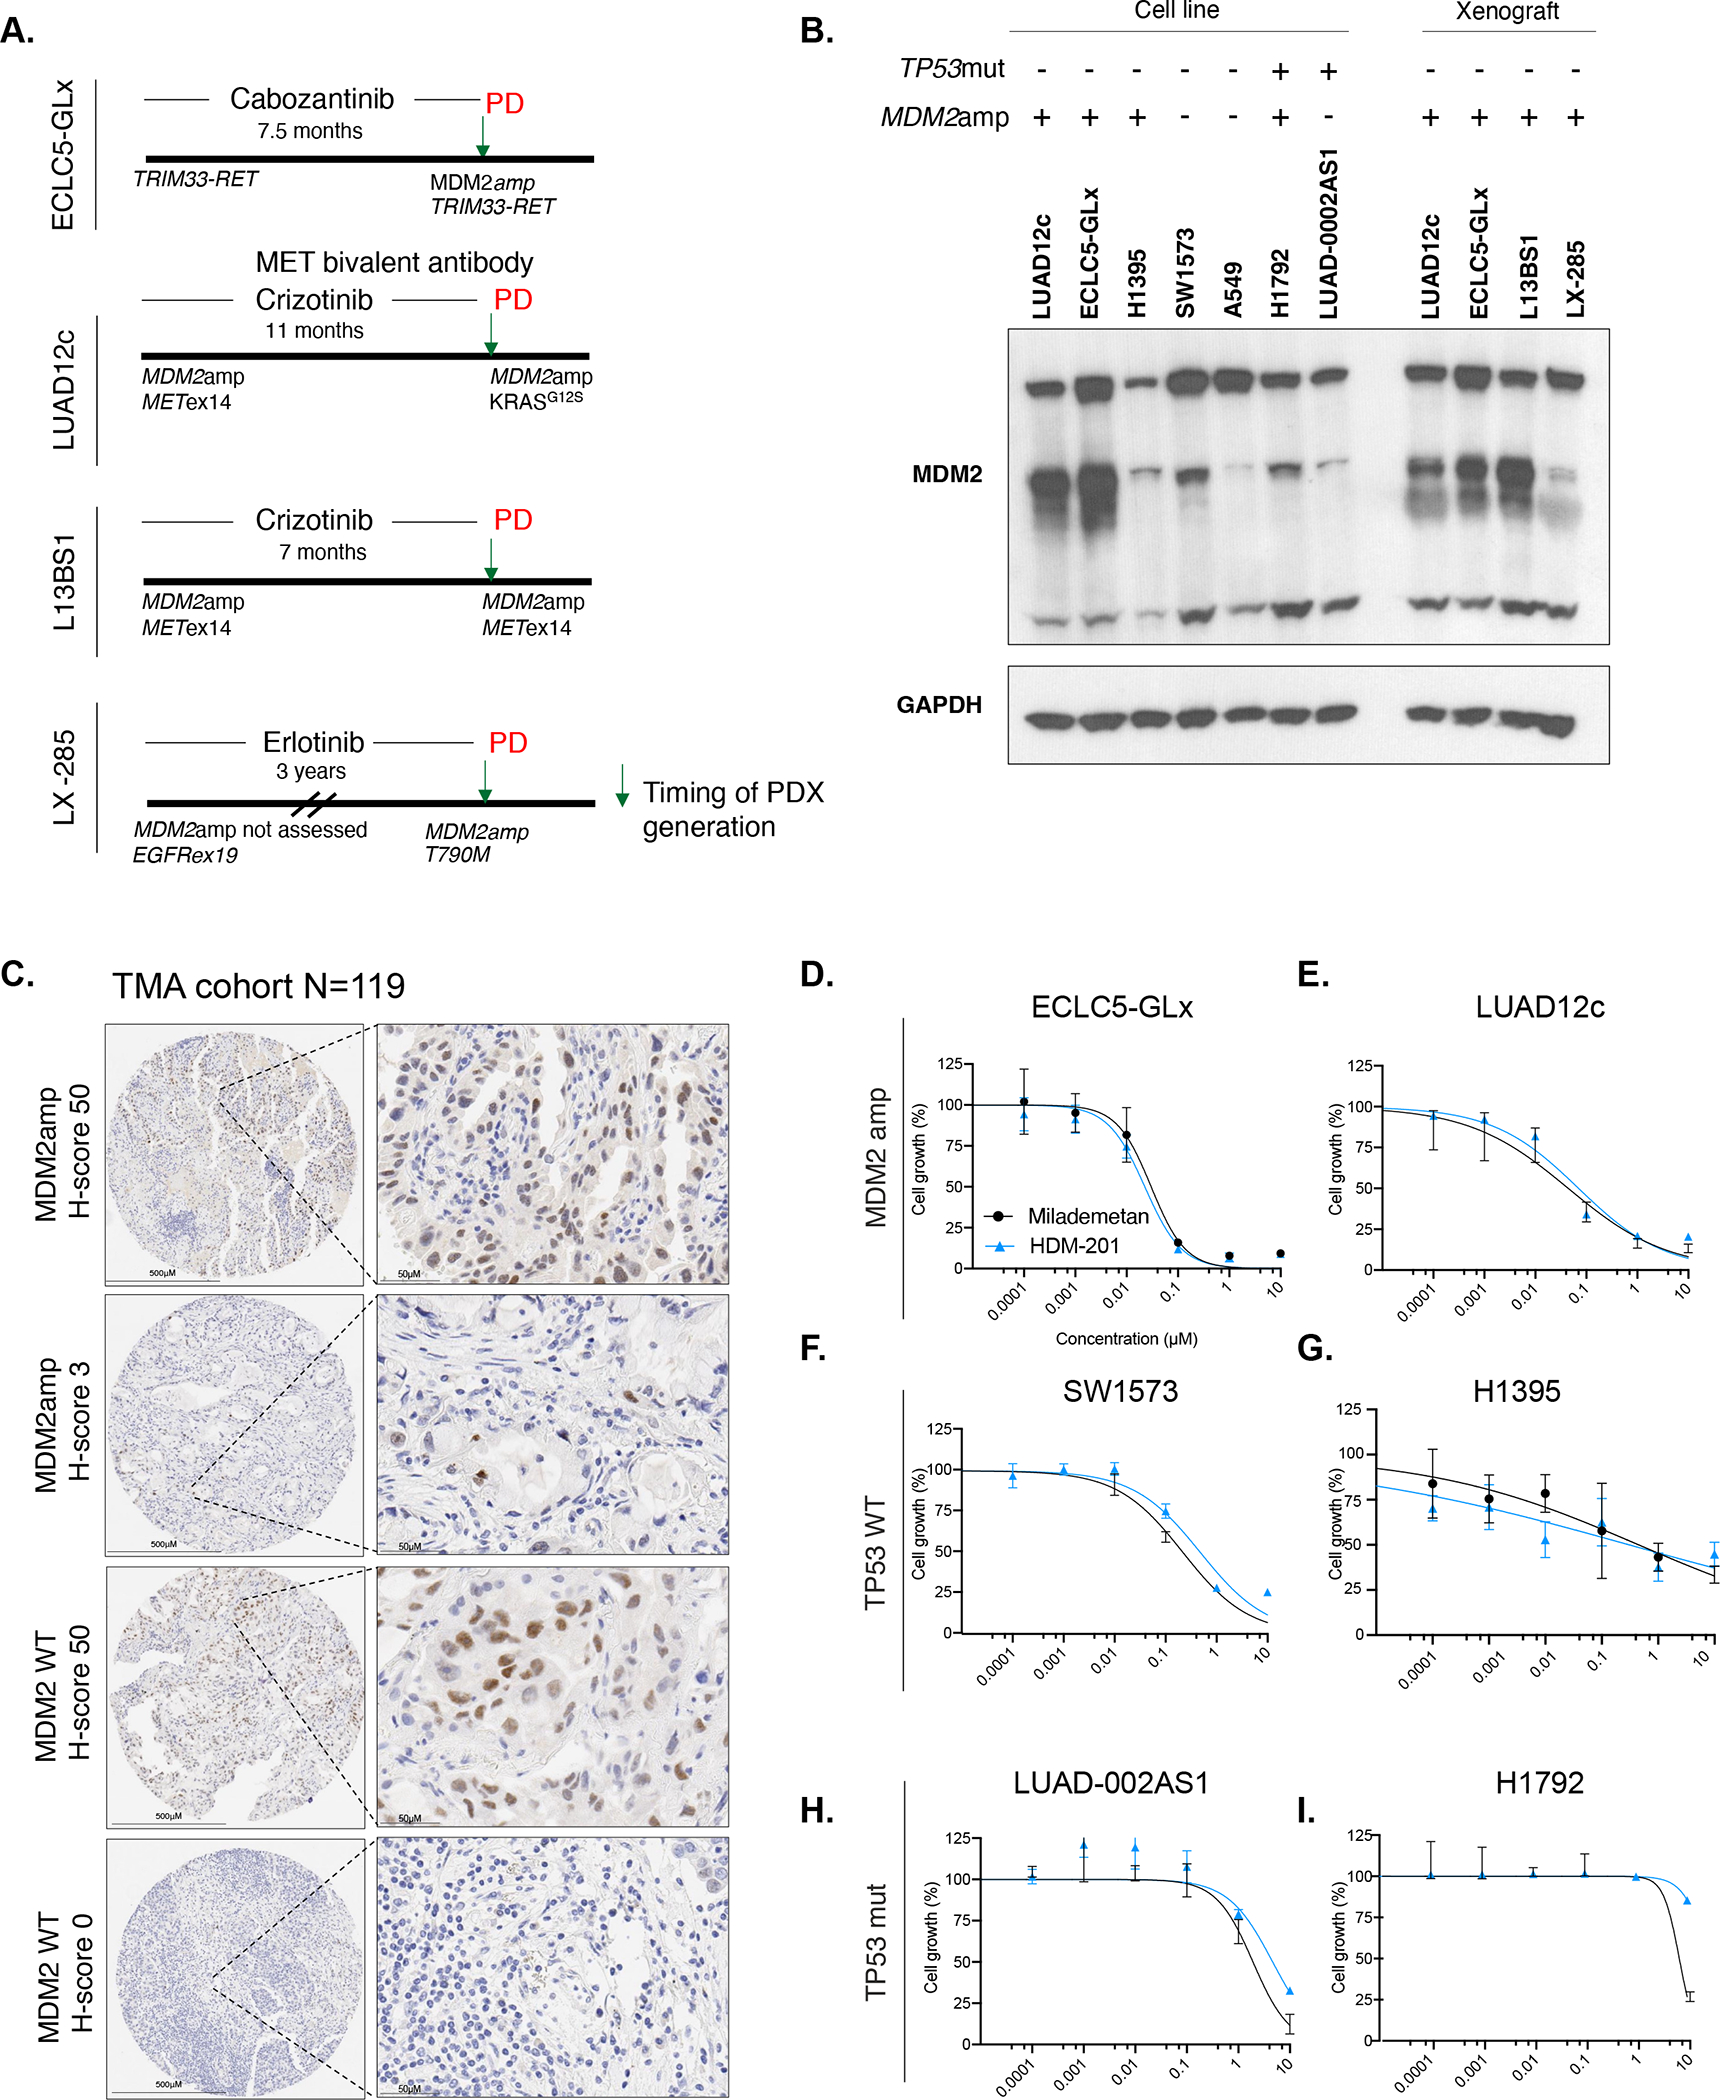
Figure 2. Generation of patient-derived xenografts with concurrent MDM2amplification and concurrent driver alterations.

A. Timeline representation of patient-derived models used in the study. Timeline indicates whether the MDM2amplification was present at diagnosis or acquired, as well as the occurrence of relevant acquired co-alterations. Timeline also indicates the time on oral targeted therapy prior to generation of the model. PD indicates progression of disease and arrow represents time of generation of the model. B. Western blot showing MDM2 expression in MDM2amp and TP53mut cell lines as well as patient-derived xenografts generated from mouse tumors (for patient derived cell lines ECLC5-GLx and LUAD12c, in addition to MDM2 expression in the cell line, MDM2 expression was also tested in the untreated xenograft tumors at 7 days). All three isoforms of MDM2 are shown, with GAPDH used as a loading control. At least two independent experiments were conducted. C. Representative images of immunohistochemistry of MDM2 expression according to MDM2 genotype. D. Single-agent activity of MDM2 small molecule inhibitors HDM-201 and milademetan in MDM2-amplified models ECLC5-GLx and E. LUAD12c F. TP53 wildtype models SW1573 and G. H1395 and TP53-mutant models H. LUAD-0002AS1 and I. H1792. Values are expressed relative to the vehicle-treated control (100%). Data were analyzed by nonlinear regression to determine IC50 for inhibition of growth (see Supplemental Table 4 for IC50 values). Results represent the mean ± SD of three replicate determinations in one experiment and repeated in an independent experiment. **p<0.01. MDM2amp; MDM2 amplification. TP53mut; TP53-mutant.
