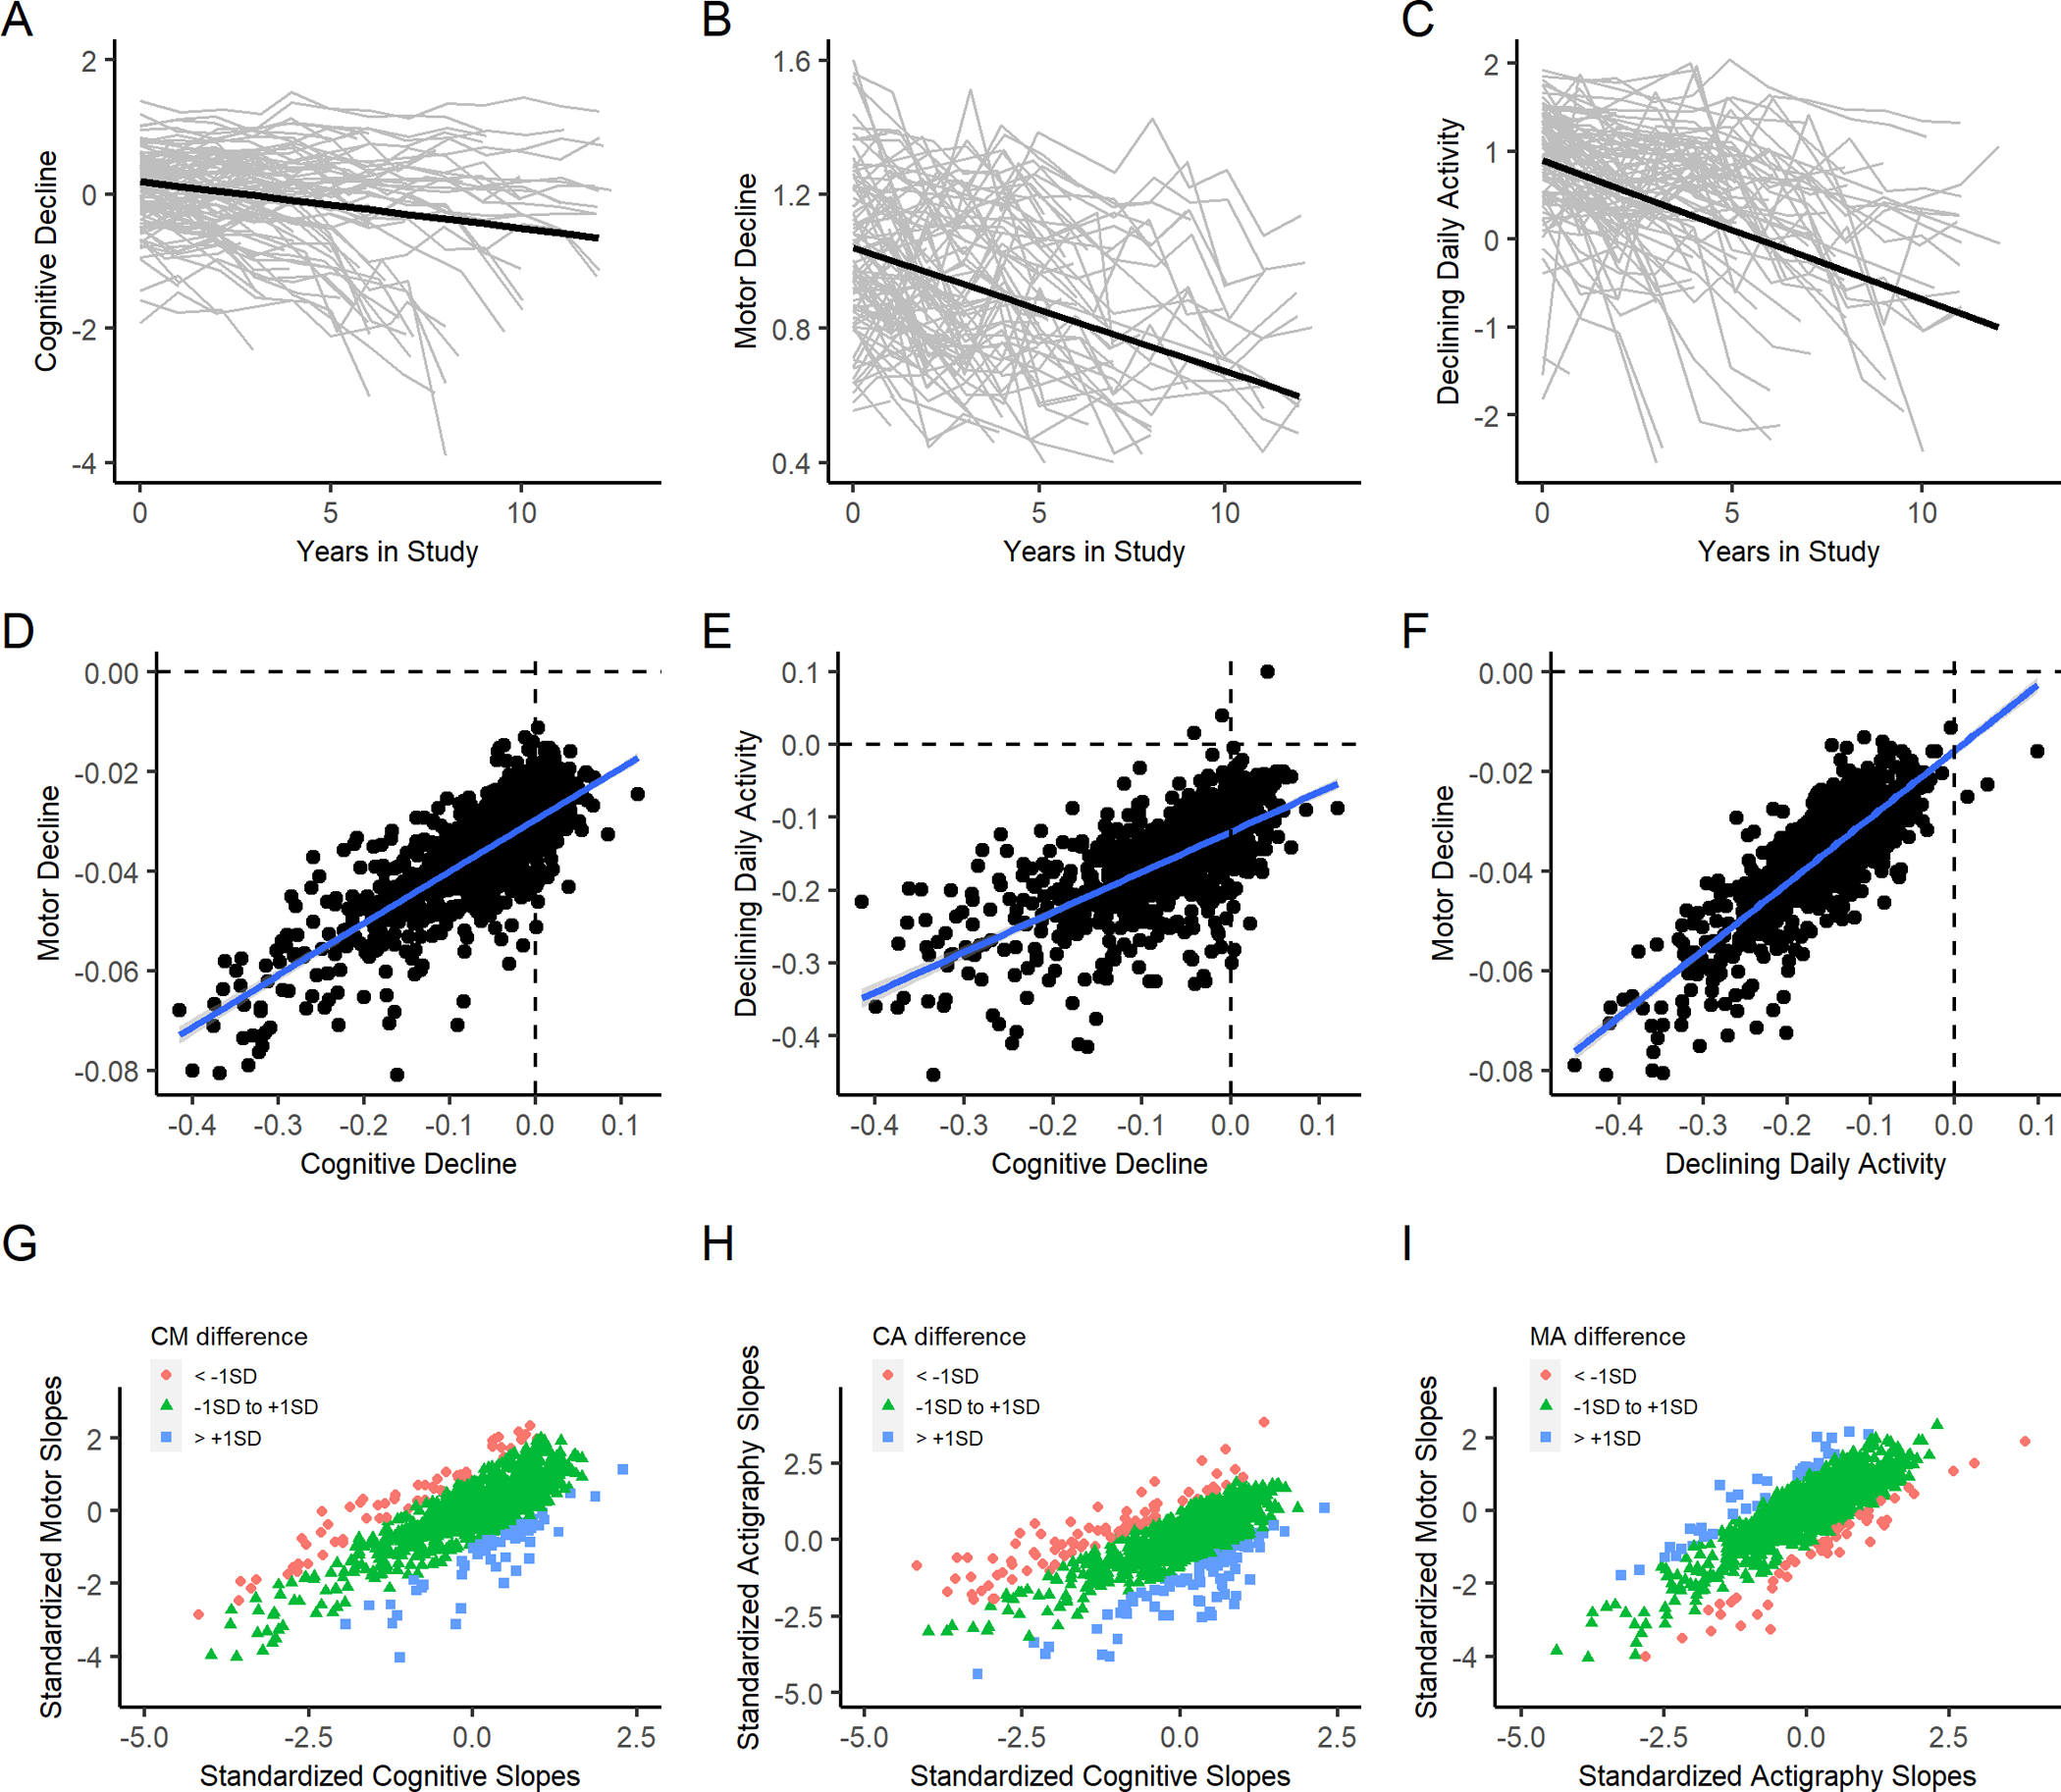
Figure 1. Simultaneous decline of cognition, motor abilities and total daily activity.

Upper Row (A-C) show the longitudinal trajectories of repeated measures of cognition (A) motor abilities (B) and total daily physical activity (C) during the study. Crude longitudinal trajectories of repeated measures of each of the three phenotypes (gray lines) and mean paths of decline predicted for each phenotype (black lines). Middle Row (D-F) shows the inter-relationship between the slopes extracted from a single trivariate model that examined the simultaneous rates of change for the three phenotypes. Each panel in the row shows a scatter plot of participants based on their person-specific rate of change (slope) in a pair of the examined phenotypes (black circles) and a regression line (blue) is superimposed on each of the three panels. D shows the slopes of cognitive decline (X axis) and motor decline (Y axis); E shows the slopes of cognitive decline (X axis) and total daily activity and F shows the slopes of declining daily activity (X axis) and motor decline (Y axis). Bottom Row (G-I): Using standardized slopes, the bottom row extends the associations illustrated in the middle row to show the extent of discrepancy between the three pairs of slopes. Slopes were considered non-discrepant if the pair of slopes was within 1 SD of one another (green). Slopes were discrepant their slopes were greater than 1 SD (blue) or less than 1 SD (red). As in the middle row, G) shows the slopes of cognitive-motor decline (CM); H shows the slopes of cognitive-daily physical activity decline (CA); I shows the slopes of motor-daily physical activity decline (MA). About 80% (n=775, 77%) showed non-discrepant slopes.
