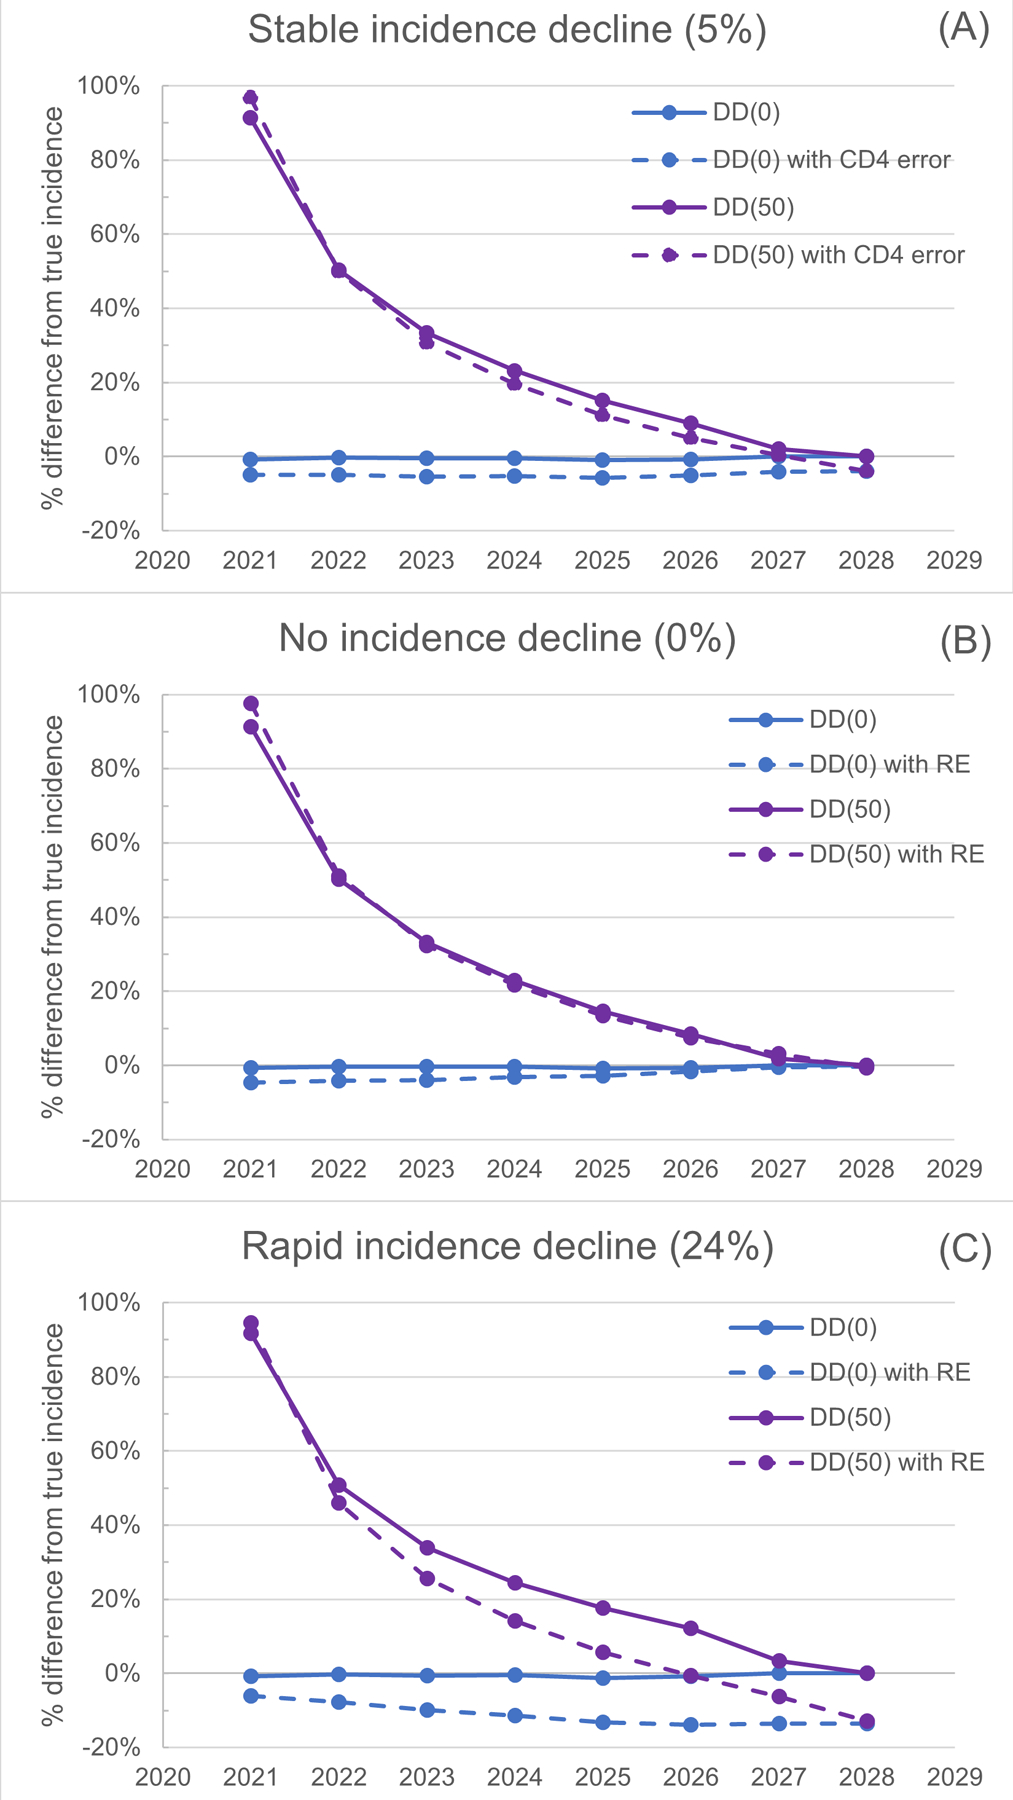
Figure 2:

HIV incidence estimates using CD4 model compared with simulated incidence. Panel A demonstrates scenarios where there is a 5% annual decline in simulated incidence. Panel B demonstrates scenarios where there is a 0% annual decline in simulated incidence. Panel C demonstrates scenarios where there is a 24% annual decline in simulated incidence. Lines are labeled according to their delay between infection and diagnosis – [DD(0), blue] for no change and [DD(50), purple] for 50% decrease compared to baseline (purple) – and inclusion of recency error (RE, dashed lines) that results from using CD4 depletion to estimate the duration of infection at diagnosis.
