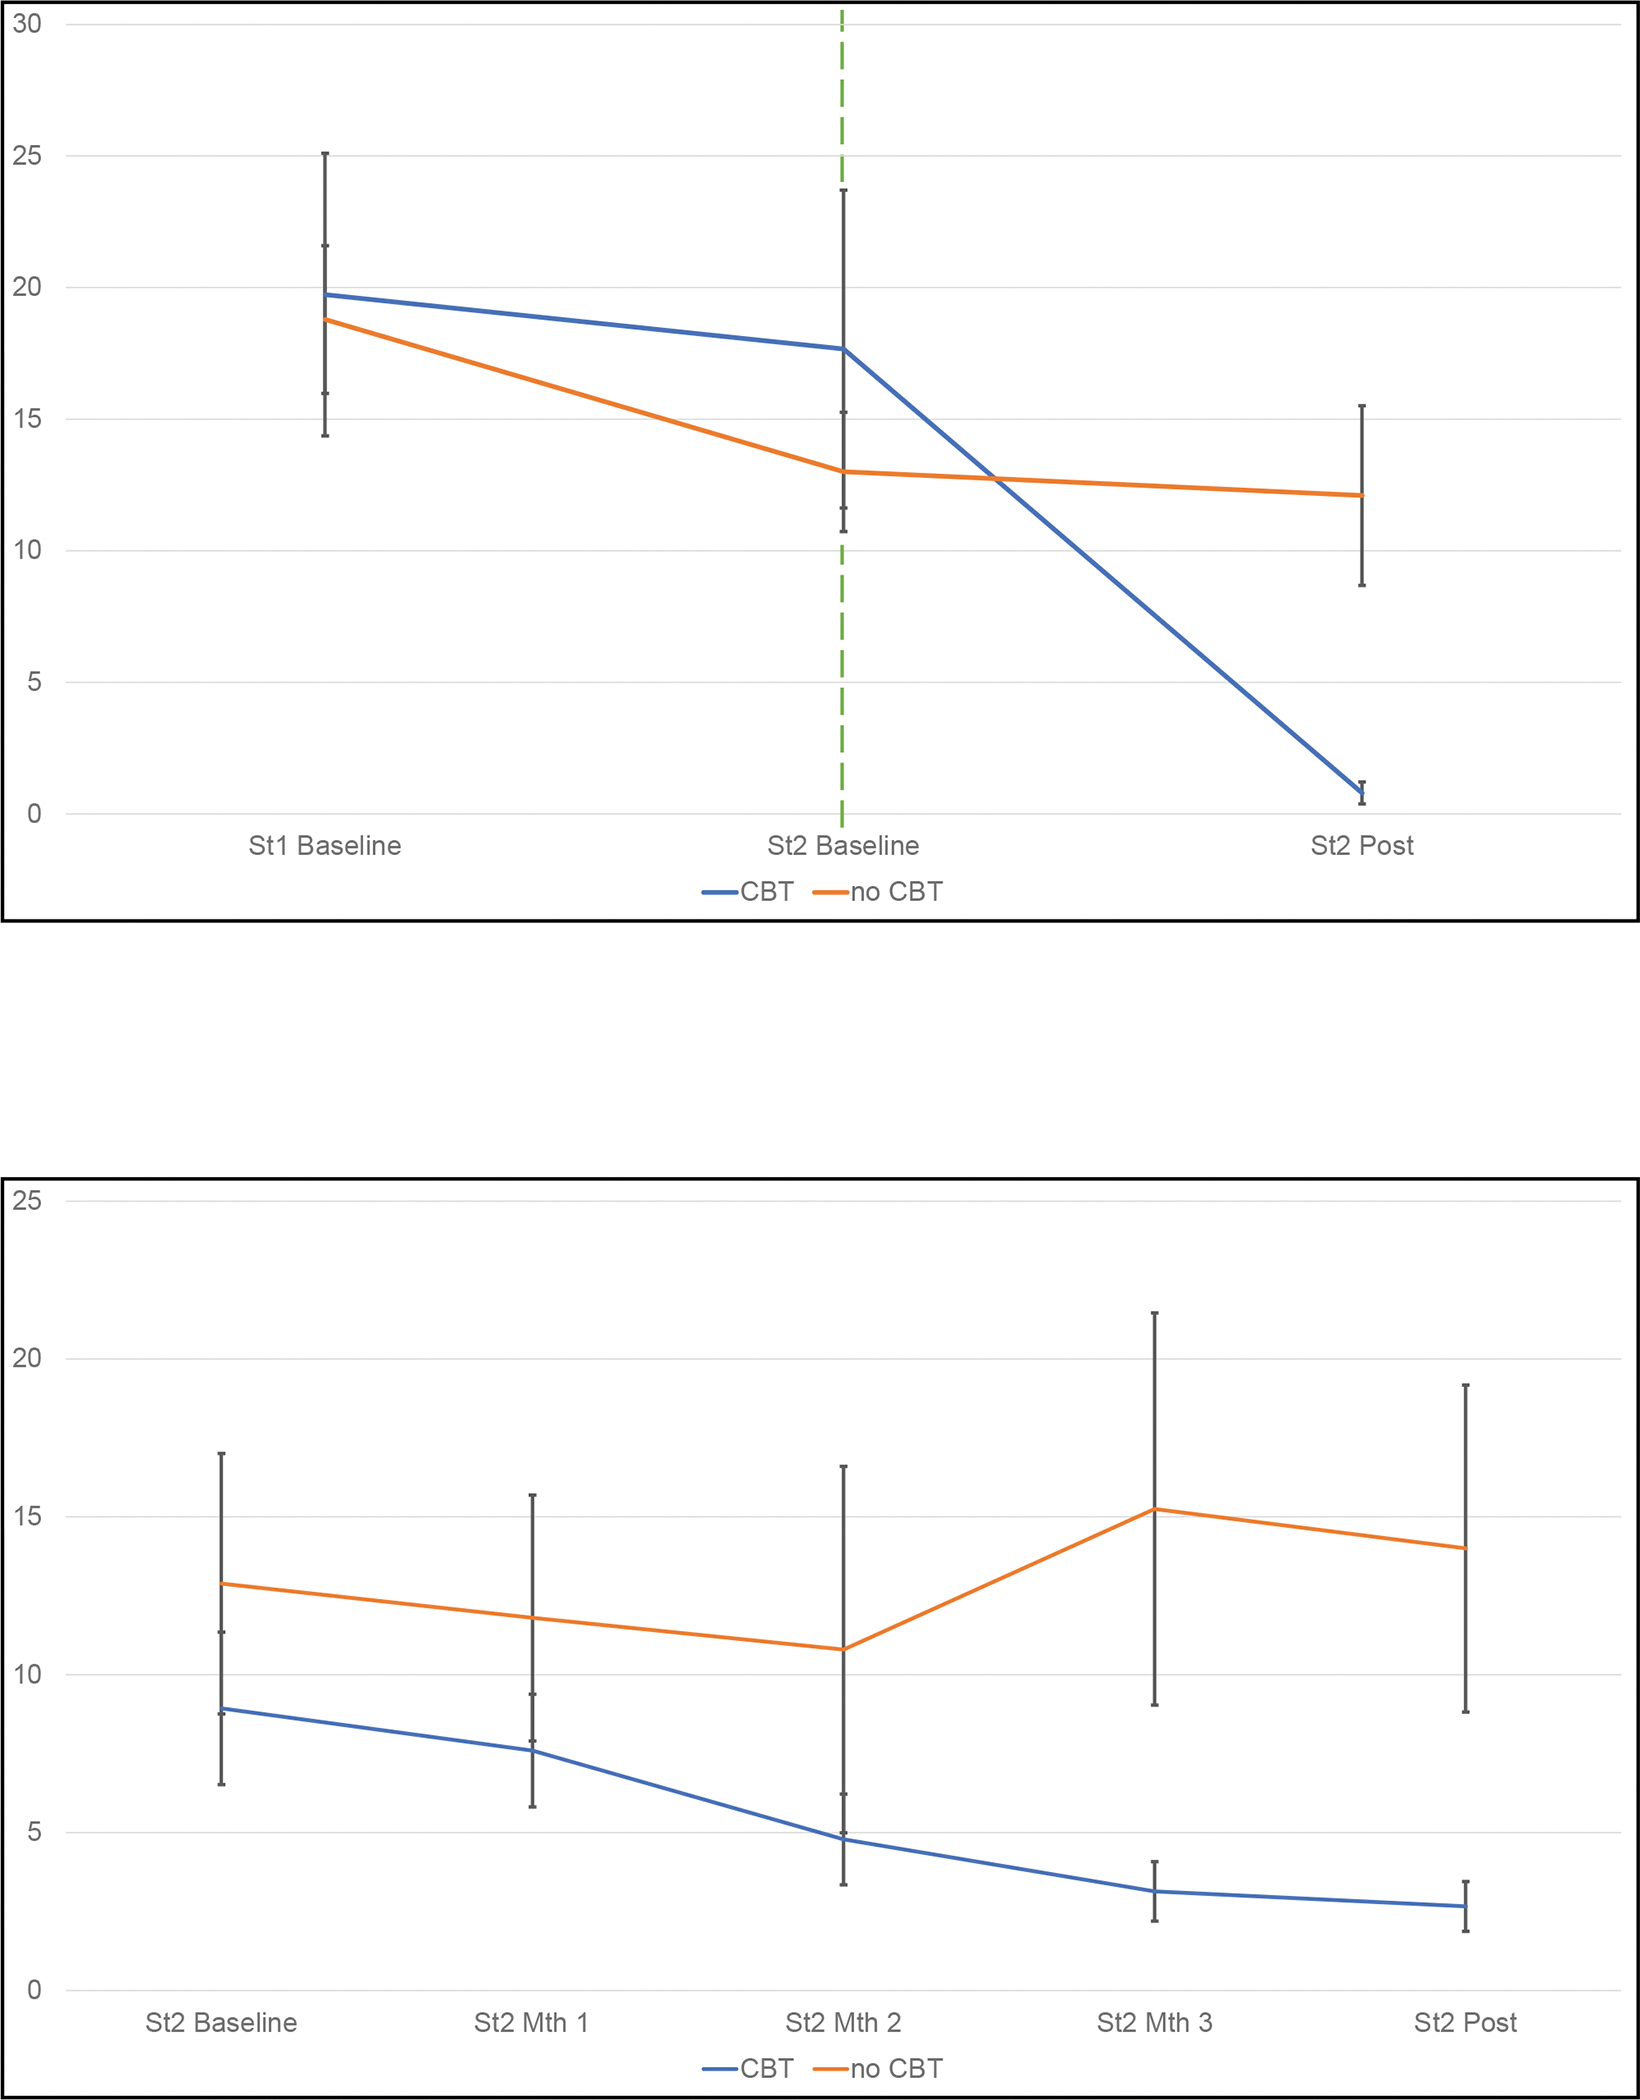
Figure 2. Binge-eating across treatment conditions.

A Frequency of binge eating during the last 28 days shown at baseline and at post-treatment (assessed using the Eating Disorder Examination interview). The two lines to the right of the vertical line show the raw binge-eating frequencies separately for CBT and no-CBT conditions during this Stage 2 trial for non-responders to the initial (Stage 1) treatments. For context, to the left of the vertical line, the lines show the frequencies of binge-eating during the initial acute (Stage 1) treatments for the participants who were eventually classified as “non-responders” and subsequently randomized to either CBT or no-CBT. Error bars indicate standard error.
B Frequency of binge eating during the last 28 days shown at baseline, monthly, and at post-treatment (assessed using the Eating Disorder Examination-Questionnaire administered monthly) for this Stage 2 trial. The two lines show the raw binge-eating frequencies separately for CBT and no-CBT conditions during this Stage 2 trial for non-responders to the initial (Stage 1) treatments. Error bars indicate standard error.
