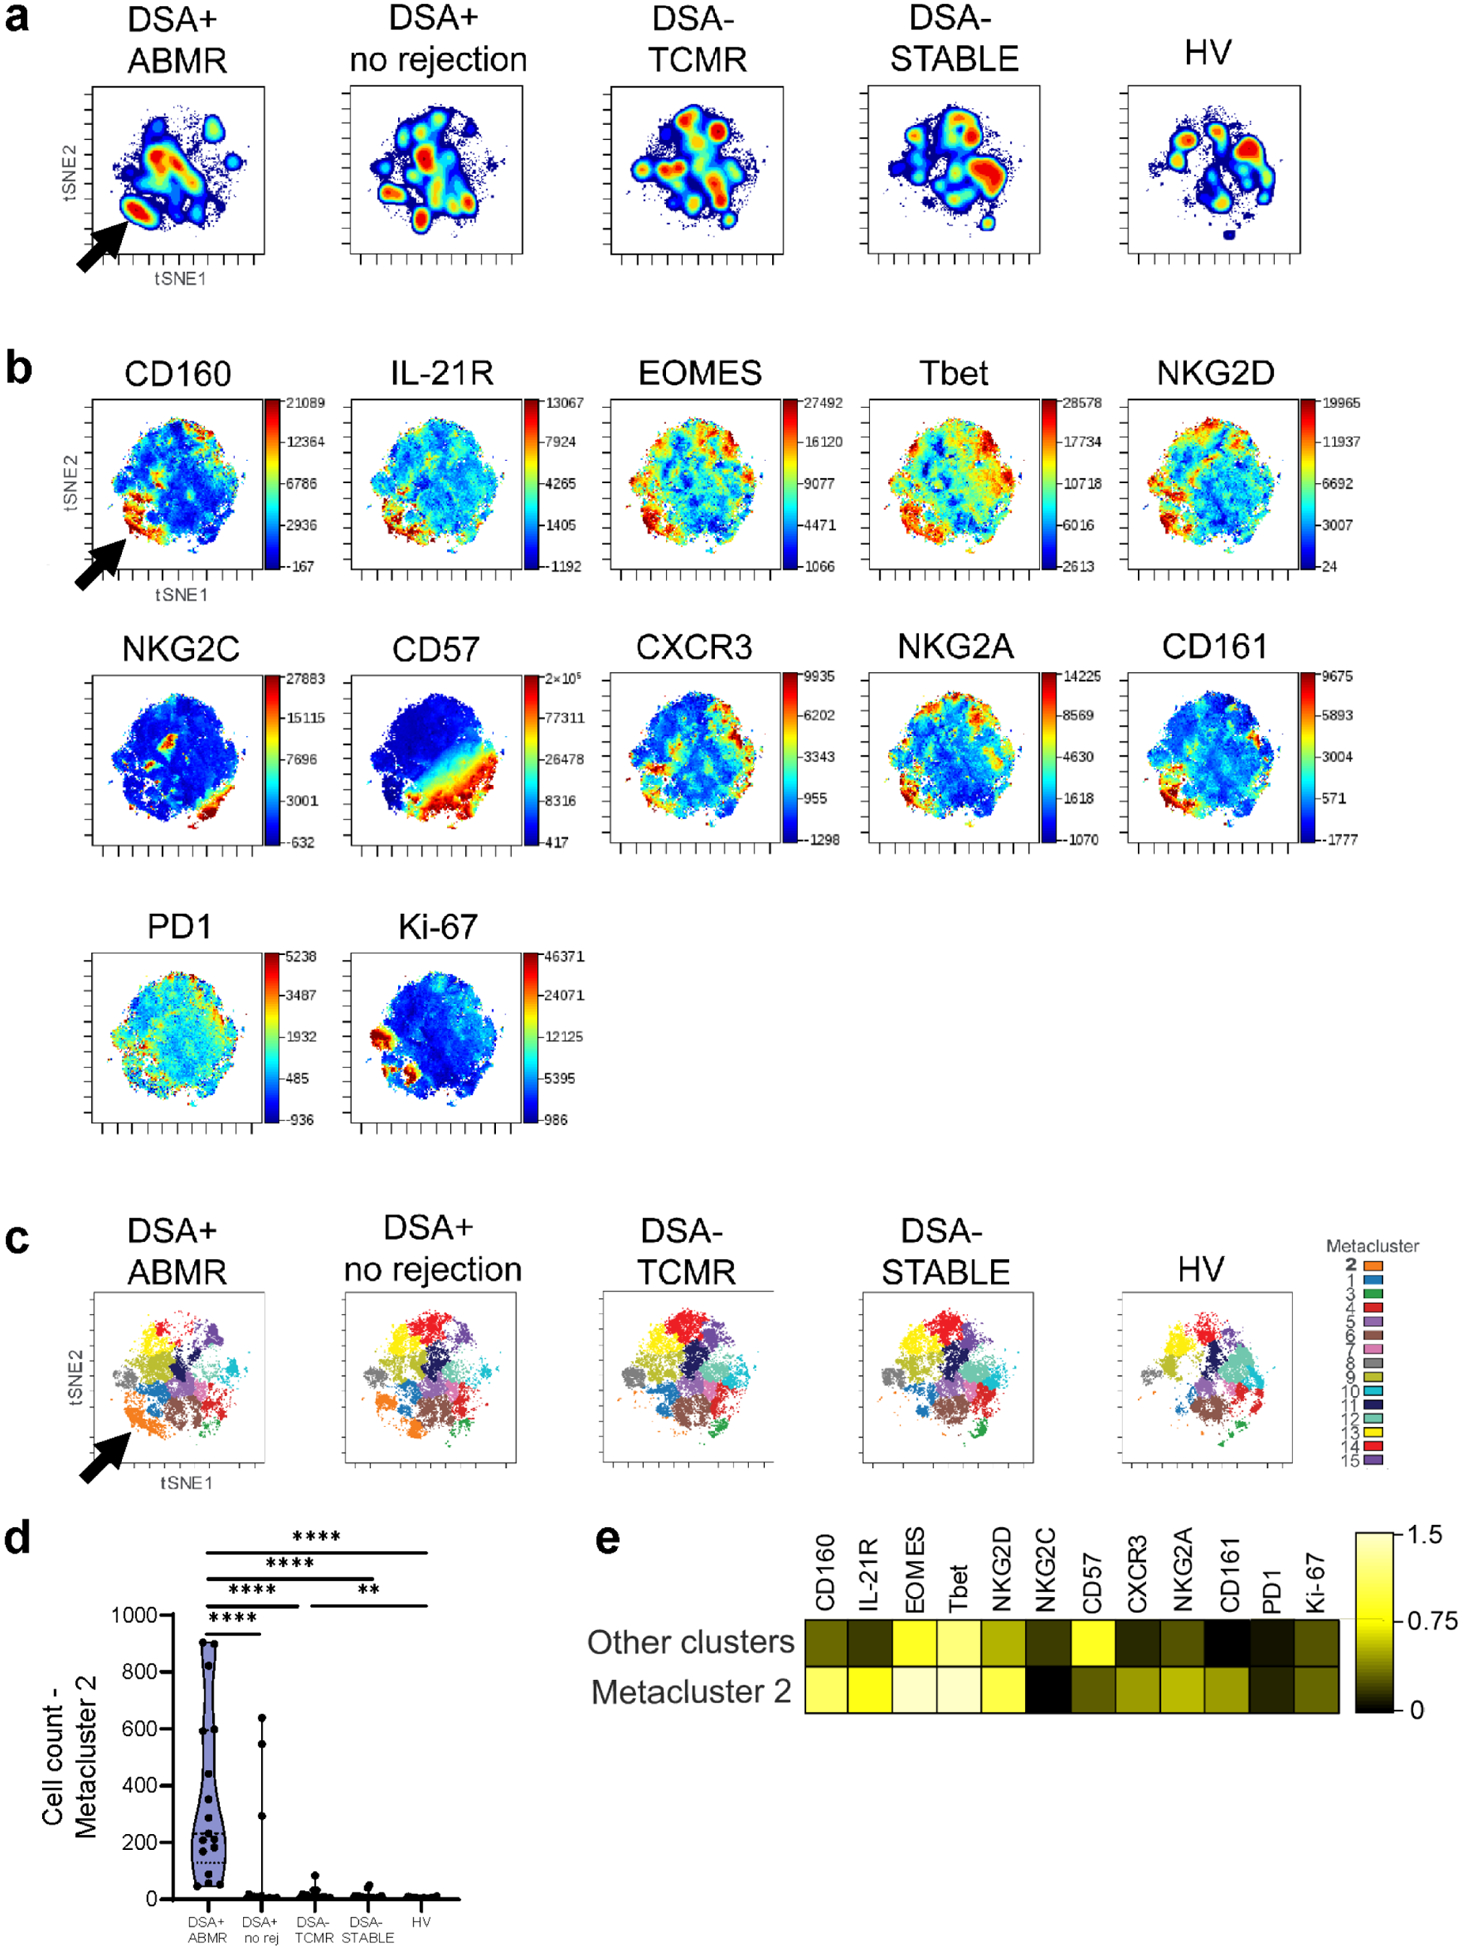
Figure 1|. High-dimensional spectral flow cytometry analysis of CD56dimCD16bright natural killer cells from patients with donor-specific alloantibody-positive mixed antibody-mediated rejection (DSA + ABMR) reveals a cytotoxic, pro-inflammatory cell cluster with high interleukin-21 receptor (IL-21R) expression.

(a) t-Distributed stochastic neighbor embedding (t-SNE) projections generated from concatenated files for each group displaying cell density distribution, n = 71 patients and n = 20 healthy volunteers (HVs). (b) t-SNE projections displaying cell surface marker mean fluorescence intensity (MFI) gradients, (c) FlowSOM (Flow Self-Organizing Map) clustering for the 5 study groups, (d) Distribution of cluster 2 among the groups. Mann-Whitney test. **P < 0.01, ****p < 0.0001. (e) Heatmap with markers' MFI for cluster 2 versus the other clusters. Transformed ratio of the median MFI, displayed by column's minimum. CXCR3, CXC chemokine receptor 3; DSA+ no rejection, donor-specific alloantibody-positive without microvascular inflammation/rejection episodes; DSA− STABLE, donor-specific alloantibody-negative without microvascular inflammation/rejection episodes; DSA− TCMR, donor-specific alloantibody-negative T cell–mediated rejection; NKG2A, natural killer group 2A; NKG2C, natural killer group 2C; NKG2D, natural killer group 2D; PD1, programmed cell death protein 1.
