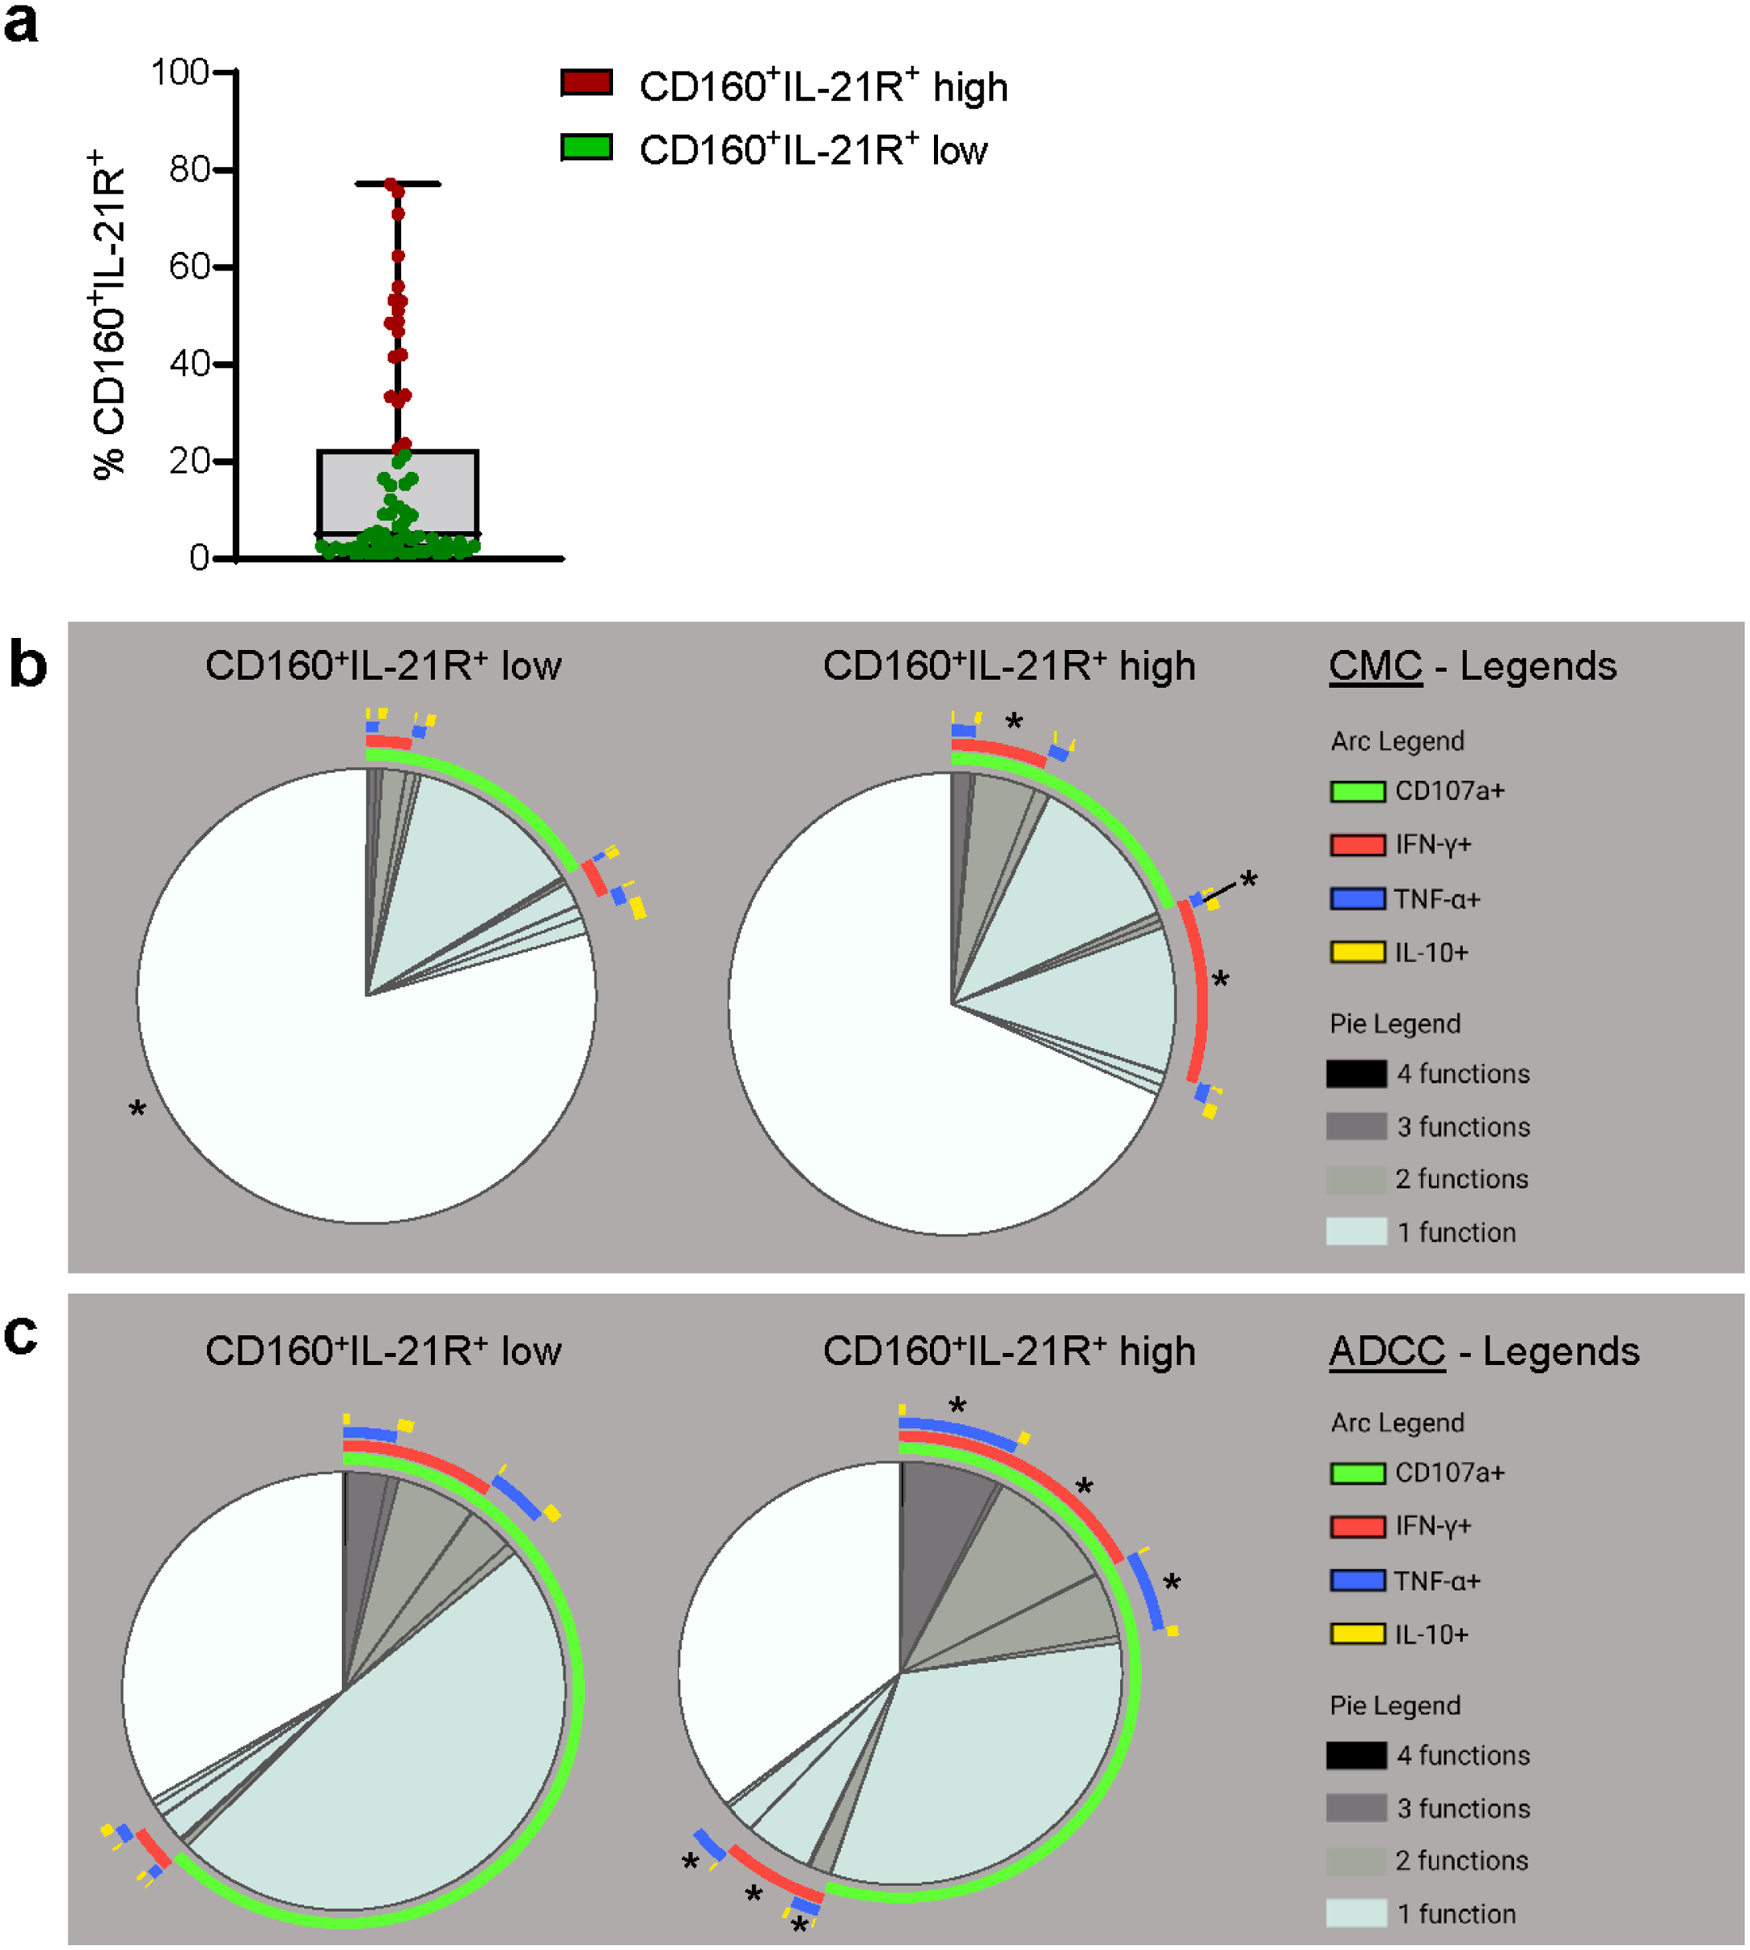
Figure 3|. Polyfunctionaiity and higher pro-inflammatory cytokine release are observed in patients with a high percentage of CD160+IL-21R+CD56dimCD16bright natural killer (NK) cells.

(a) Distribution of the percentage of CD160+IL-21+CD56dimCD16bright NK cells among the 71 kidney transplant recipients, identifying a group of 18 patients with high CD160+IL-21R+ expression (≥75th percentile) in red and 53 patients with low CD160+IL-21R+ expression in green. (b,c) CD56dimCD16bright NK cell degranulation and cytokine production in (b) cell-mediated cytotoxicity (CMC) and (c) antibody-dependent cellular cytotoxicity (ADCC) experiments according to CD160+IL-21R+ expression in 27 kidney transplant recipients with low (2 patients showing donor-specific alloantibody-positive mixed antibody-mediated rejection [DSA+ ABMR], 6 patients who were DSA-positive without microvascular inflammation/rejection episodes [DSA+ no rejection], 9 patients showing DSA-negative T cell-mediated rejection [DSA− TCMR], and 10 patients who were DSA-negative without microvascular inflammation/rejection episodes (DSA− STABLE]) versus 9 patients with high (6 DSA+ ABMR, 3 DSA+ no rejection) CD160+IL-21R+ expression. Boolean gates were created for CD 107a, interferon-γ (IFN-γ), tumor necrosis factor-α (TNF-α), and interleukin-10 (IL-10). Polyfunctional data were analyzed using the Simplified Presentation of Incredibly Complex Evaluations (SPICE) software (National Institutes of Health and National Institute of Allergy and Infectious Diseases). The pie charts display the mean frequencies of degranulating and/or cytokine-secreting CD56dimCD16bright NK cells for each possible combination of CD107a/IFN-γ/TNF-α/IL-10. Pie segments are color coded to represent monofunctionality to polyfunctionaiity. The arcs illustrate the analyte(s) produced by the pie segment underneath. Mann-Whitney tests were used to compare each pie segment between the 2 groups. Significance symbols were displayed on the pie segment with increased proportion. *P < 0.05.
