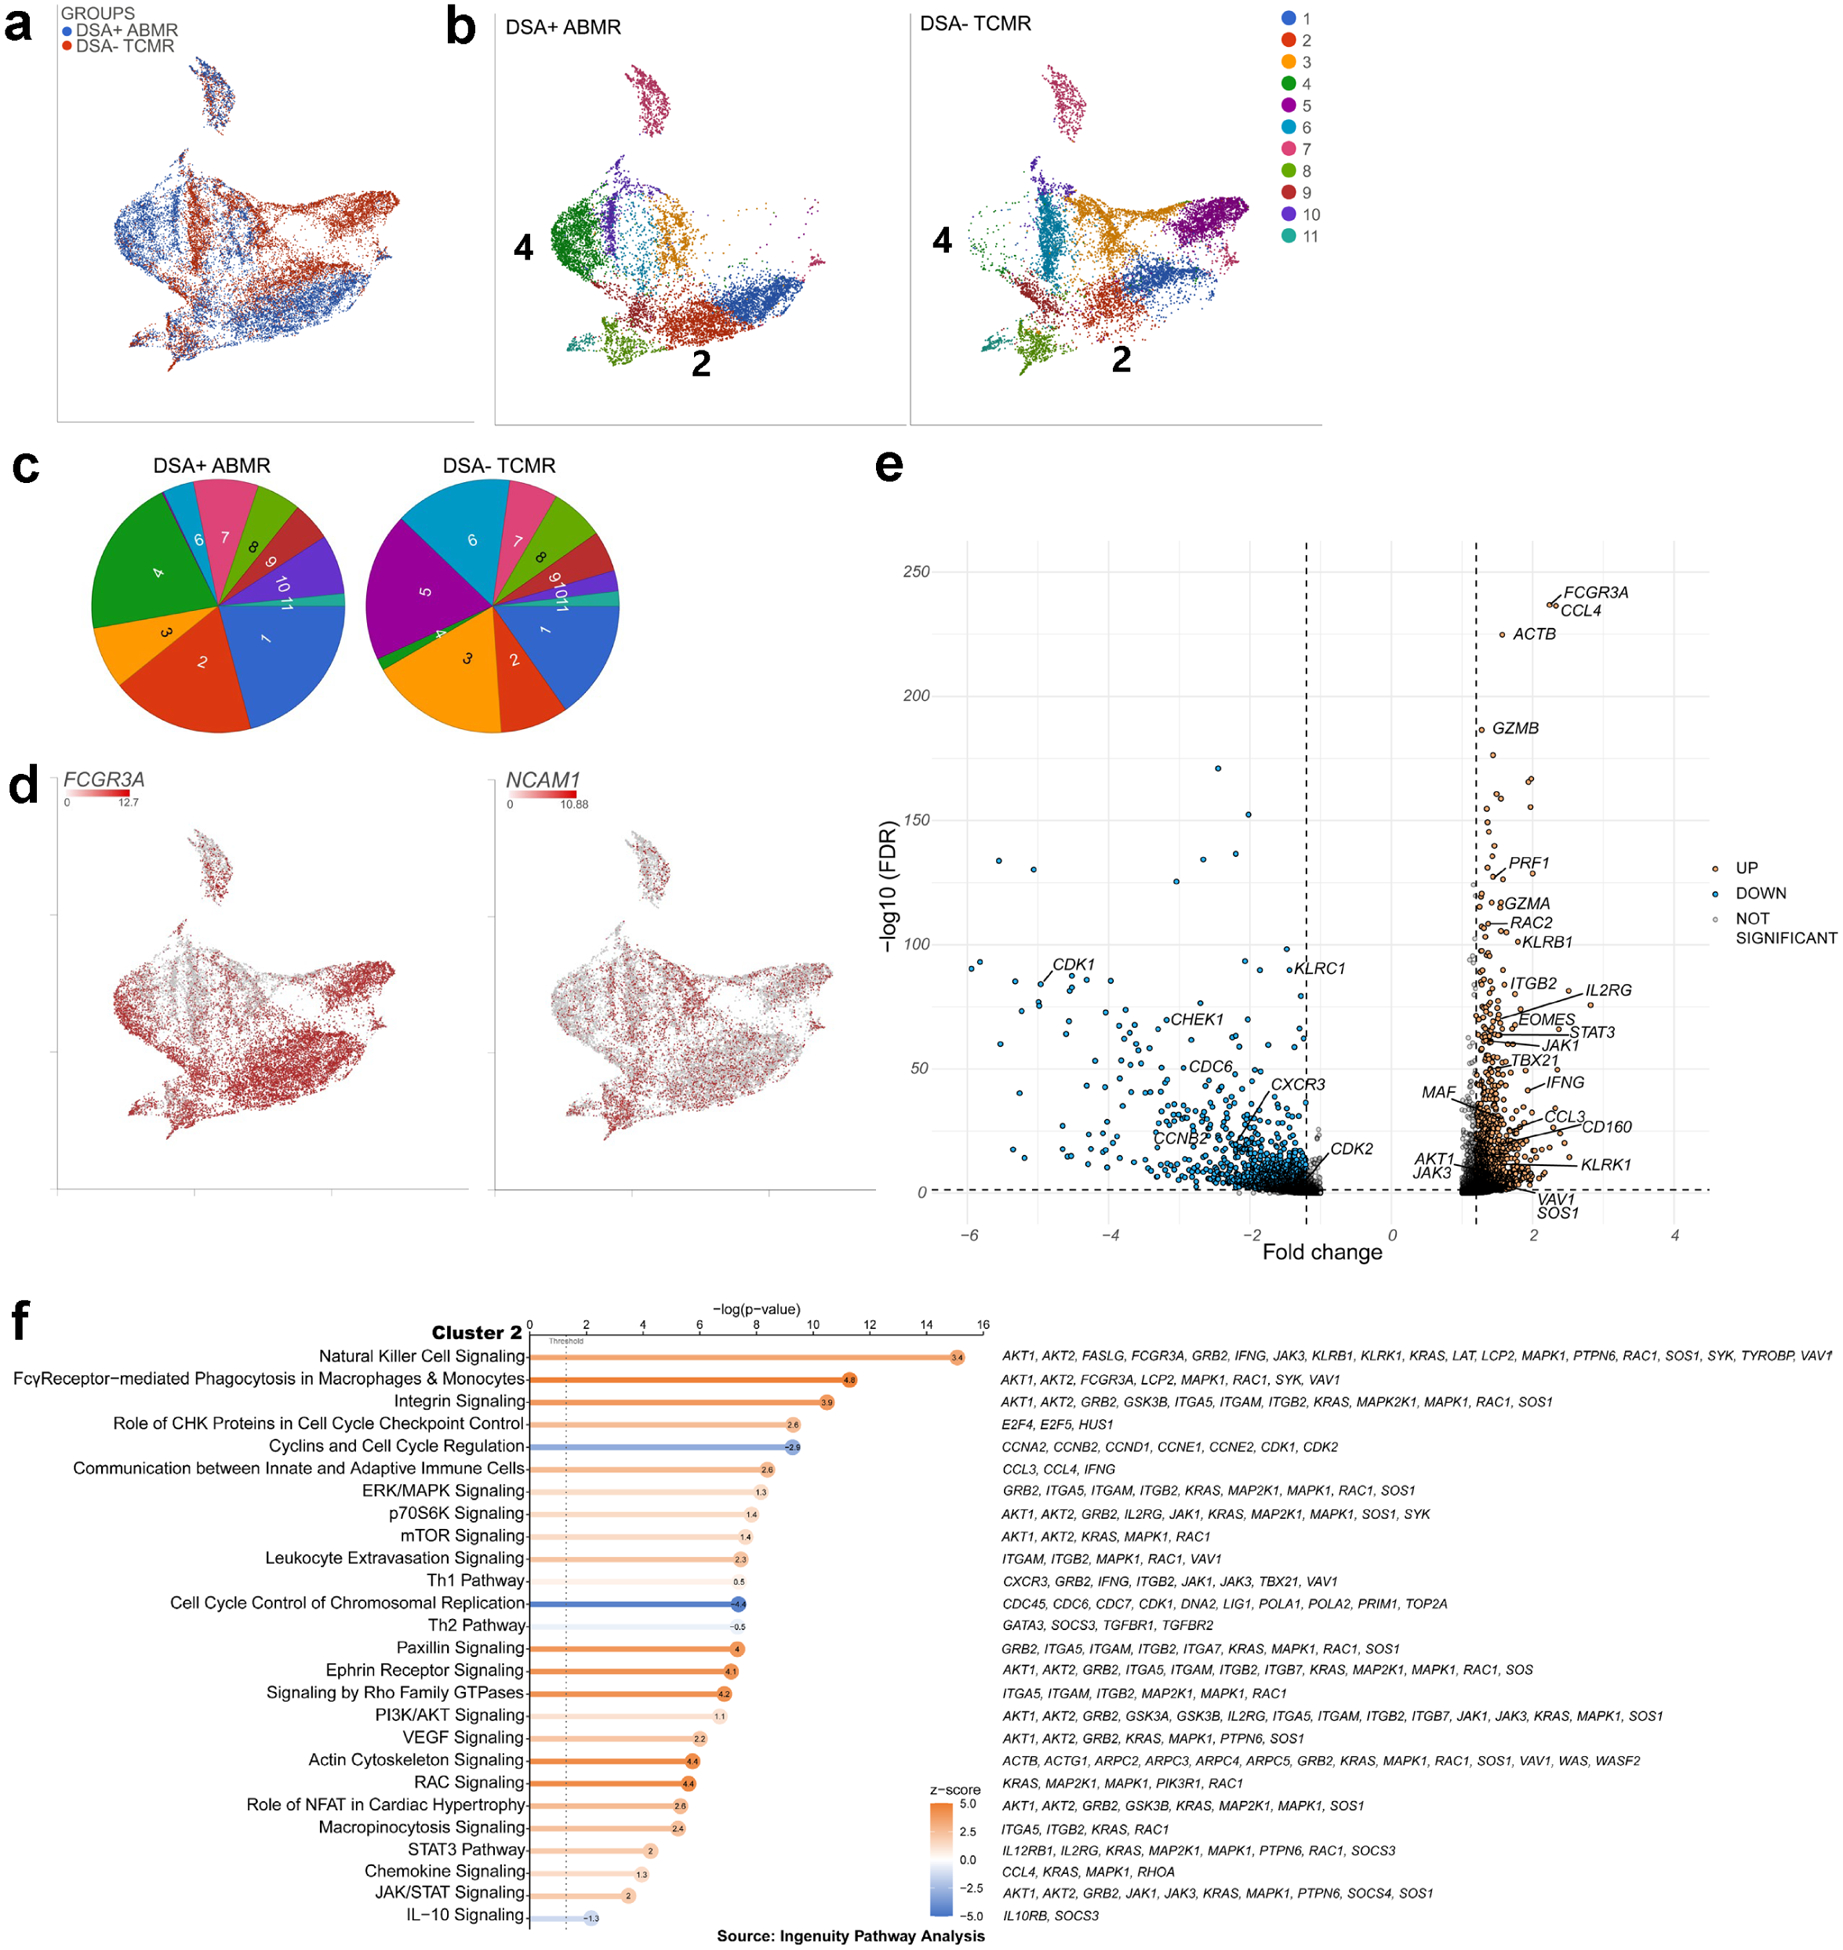
Figure 5|. Three prime v3 single-cell RNA sequencing of fluorescence-activated cell sorting (FACS)–sorted natural killer (NK) cells from patients with donor-specific alloantibody-positive mixed antibody-mediated rejection (DSA+ ABMR) identifies the expansion of a transcriptomic signature with cytotoxicity features and interleukin-21 (IL-21)/signal transducer and activator of transcription 3 (STAT3) pathway as compared with patients with DSA-negative T cell-mediated rejection (DSA− TCMR).

(a) Uniform manifold approximation and projection (UMAP) displaying the DSA+ ABMR and DSA− TCMR groups, n = 4 in each group, (b) UMAP displaying the graph-based clustering split by group, (c) Cluster frequency in the 2 groups, (d) UMAP featuring expression of Fc gamma receptor 3 A (FCGR3A) and neural cell adhesion molecule 1 (NCAM1) transcripts, (e) Volcano plot of selected differentially expressed genes from the analysis of variance of cluster 2 versus the other graph-based clusters. Significance was defined as fold change ≤−1.2 or ≥1.2 and false discovery rate (FDR) ≤0.05. (f) Pathway analysis (Ingenuity Pathway Analysis) of cluster 2 differentially expressed genes. Pathways are sorted by P value, and z-scores are displayed by color, with the z-score values inside the dots. Selected genes participating in each pathway are displayed on the right. AKT, serine/threonine-protein kinase AKT; CHK, checkpoint kinase; ERK, extracellular signal-regulated kinase; IL-10, interleukin-10; JAK, Janus kinase; MAPK, mitogen-activated protein kinase; mTOR, mammalian target of rapamycin; NFAT, nuclear factor of activated T cells; PI3K, phosphatidylinositol-3'-kinase; RAC, rac family small GTPase; Th1, T helper cell 1; Th2, T helper cell 2; VEGF, vascular endothelial growth factor.
