
Figure 1.
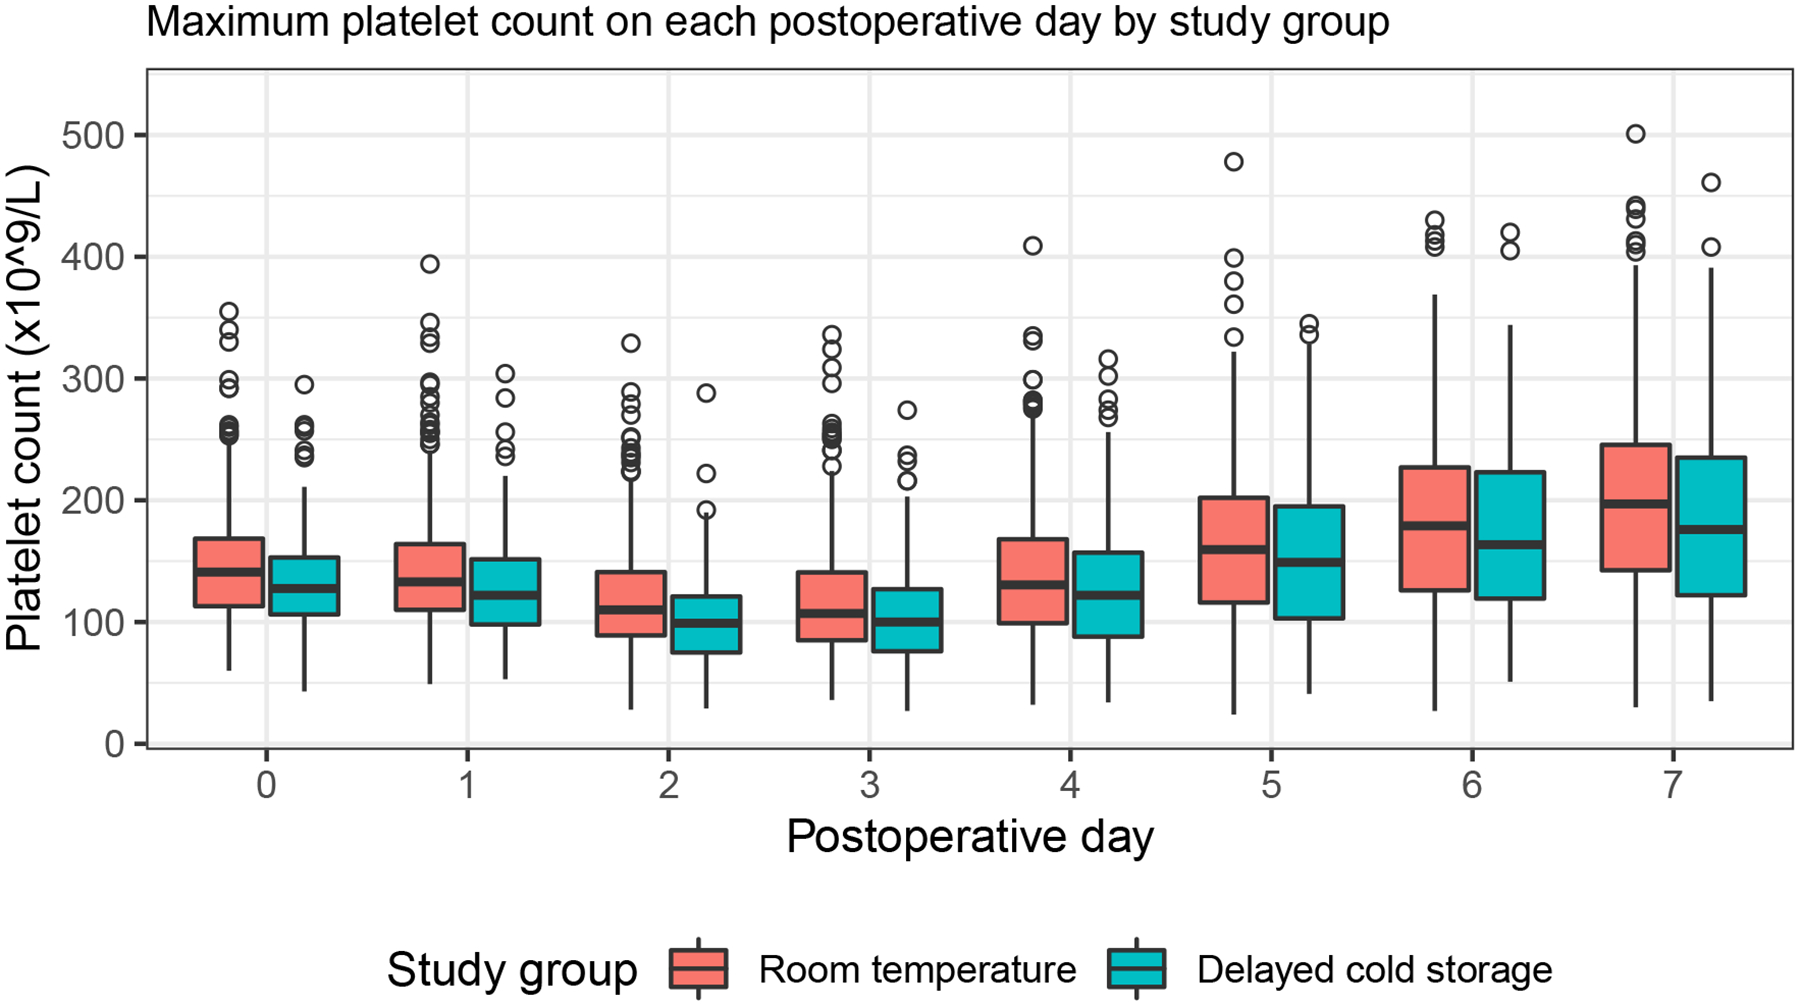
Maximum platelet counts on each postoperative day.
Distribution of maximum platelet count presented as box-and-whisker plots according to study group and postoperative day. For each box-and-whisker plot, the lower, middle, and upper horizontal lines represent the 25th, 50th, and 75th percentiles. The difference between the 75th and 25th percentiles is defined as the interquartile range (IQR). Vertical lines are drawn from the upper and lower quartiles to the maximum and minimum values within 1.5 IQR respectively. Values outside of those ranges are plotted as circles. Ninety-five percent of patients had available platelet counts through postoperative day 4, with 89%, 74%, and 58% having available platelet count on days 5, 6, and 7 respectively.