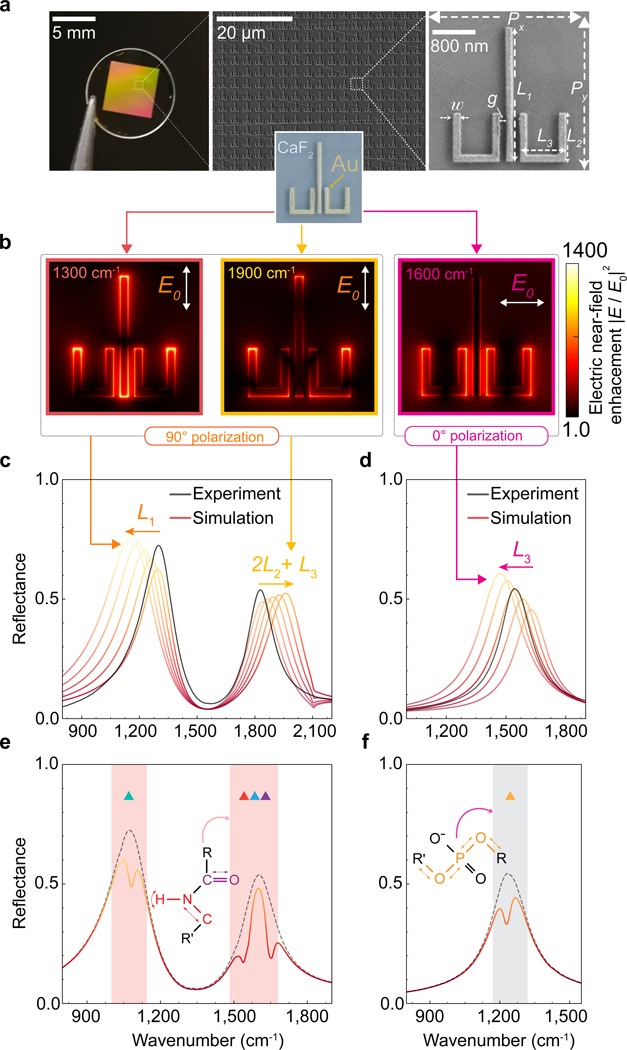
Figure 3 |. Polarization-multiplexed multi-resonant broadband plasmonic metasurface.
a, Photograph and SEM image of the two-dimensional array of plasmonic ulu nanostructures. The geometrical design parameters for the structure in the SEM image are , , , , , , and ; 90 nm thick. b, Numerically simulated electric near-field intensity enhancement maps at different resonance wavenumbers for 0 and 90 polarizations. c, d, Experimentally measured (black curves) and simulated (red-yellow gradient) reflectance spectra of the polarization-multiplexed multi-resonant plasmonic metasurface. The three resonant peaks are tuned by adjusting the geometrical parameters of the ulu structures, such as , , and , to spectrally match the absorption fingerprints of important biomolecules in the mid-Infrared region. e, f, Simulated reflectance spectra shows expected absorption signals associated with the molecular fingerprints of deoxyribose (1060 cm−1 ▲), asymmetric phosphate (1236 cm−1 ▲), -sheet (1542 cm−1 ▲), amide II (1574 cm−1 ▲), amide I (1660 cm−1 ▲). Molecular coupling with plasmonically enhanced near-field hotspots at the resonance peaks (black dashed line) leads to dips in reflection spectra at wavenumbers corresponding to the vibrational resonances of the biomolecules (solid line).

