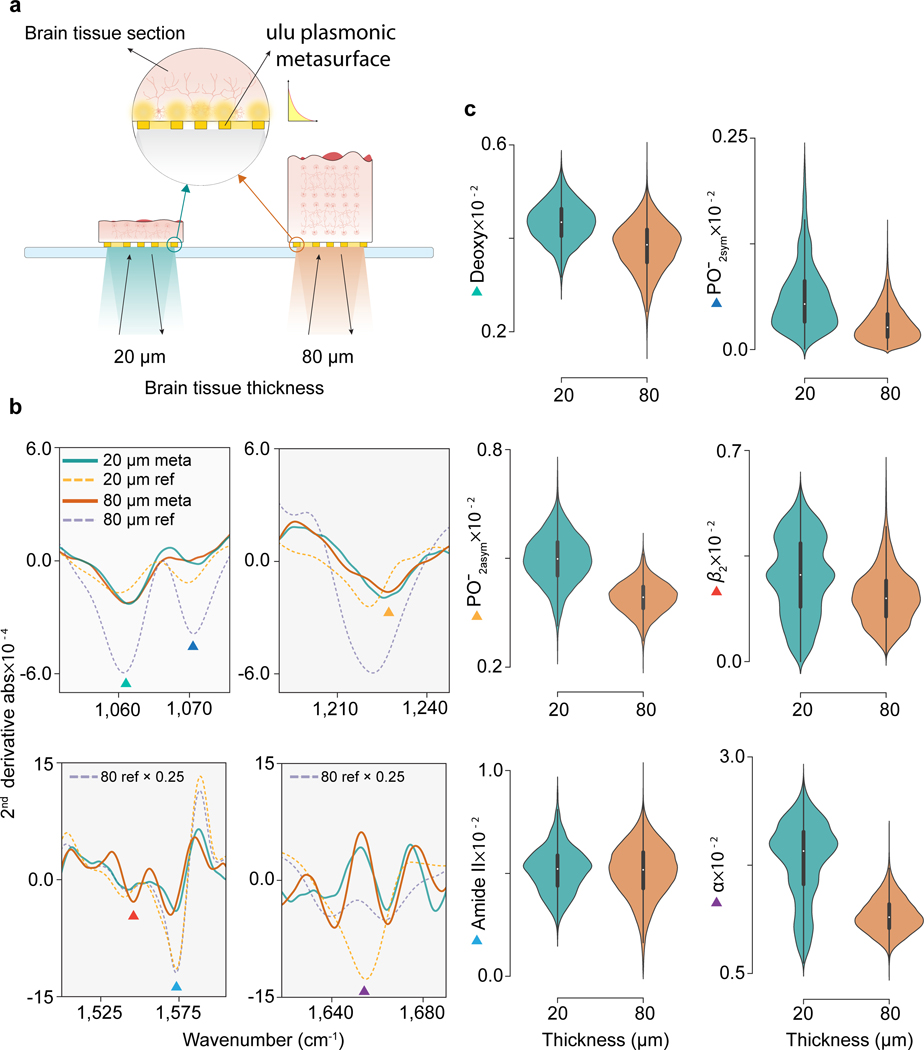
Figure 4 |. SE-MIRSI enables detection of tissue-thickness-independent molecular fingerprint.
a, Sketch of two different brain tissue sections with thicknesses of 20 μm and 80 μm, mounted on metasurface patterned CaF2 substrates. Mid-IR absorption spectra acquired in reflectance mode from the substrate side capture light-matter interactions from nanoscale electromagnetic hotspot volumes. b, Second derivative absorption spectra of 20 μm and 80 μm brain tissue sections collected by SE-MIRSI. Molecular absorption fingerprints of functional groups in brain tissue sections were detected via plasmonic metasurfaces (solid lines) and reference MIRSI absorption signals (dashed lines) were collected in transmission mode. Three different resonance peaks of the plasmonic metasurface were used to capture spectral signatures of deoxyribose (1060 cm−1 ▲), symmetric phosphate (1090 cm−1 ▲), asymmetric phosphate (1236 cm−1 ▲), -sheet (1542 cm−1 ▲), amide II (1574 cm−1 ▲), and amide I (1660 cm−1 ▲). c, Area integral under second derivative absorption spectra distributions from different pixels for the six biomolecules mentioned above. Unlike in conventional MIRSI, the absorption signals do not increase with the tissue thickness in SE-MIRSI measurements.

