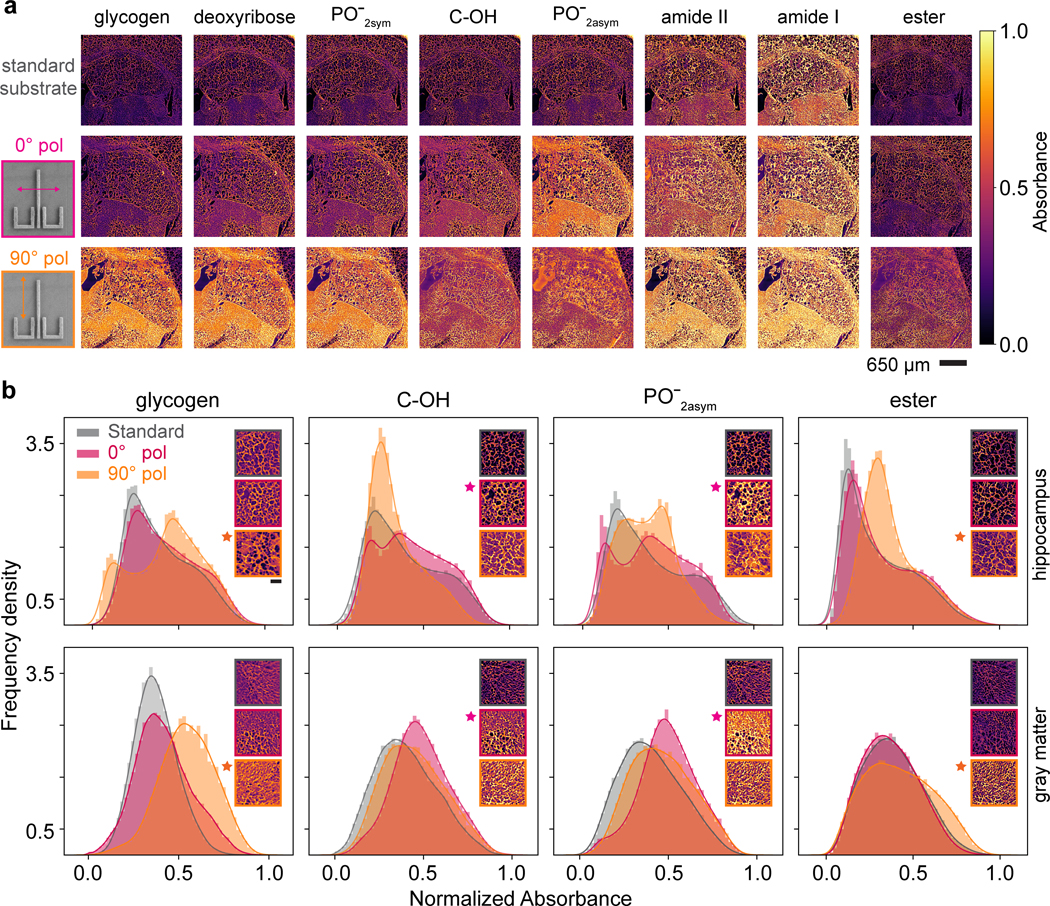
Figure 6 |. SE-MIRSI enhances molecular absorption resonances in morphologically heterogeneous tissue sections.
a, Two adjacent 20 μm-thick murine brain tissue sections are mounted on a standard CaF2 substrate for MIRSI and a plasmonic metasurface for SE-MIRSI measurements. Infrared images at eight different absorption bands corresponding to various biomolecules show similar brain tissue regions measured on a standard substrate (top row), and on a metasurface illuminated at 0 (middle row) and 90 (bottom row) polarization modes. The plasmonic resonance excited with 0 polarization enhances absorption at C-OH and PO-2asym bands and the two resonances excited with 90 polarization enhances glycogen, deoxyribose, PO-2sym, amide II, amide I, and ester bands. b, Histogram plots show absorbance frequency density distributions of 2.3105 pixels measured by standard MIRSI and SE-MIRSI at orthogonal polarizations. Two different murine brain regions of interest from hippocampus (top row) and gray matter (bottom row) are shown for four molecules. Histogram distributions corresponding to plasmonic resonances denoted by stars show intensity shifts towards larger absorbance values confirming surface enhancement.

