
Figure 1. Intact cancer cell CD58 and T cell CD2 signaling is required for anti-tumor immunity.
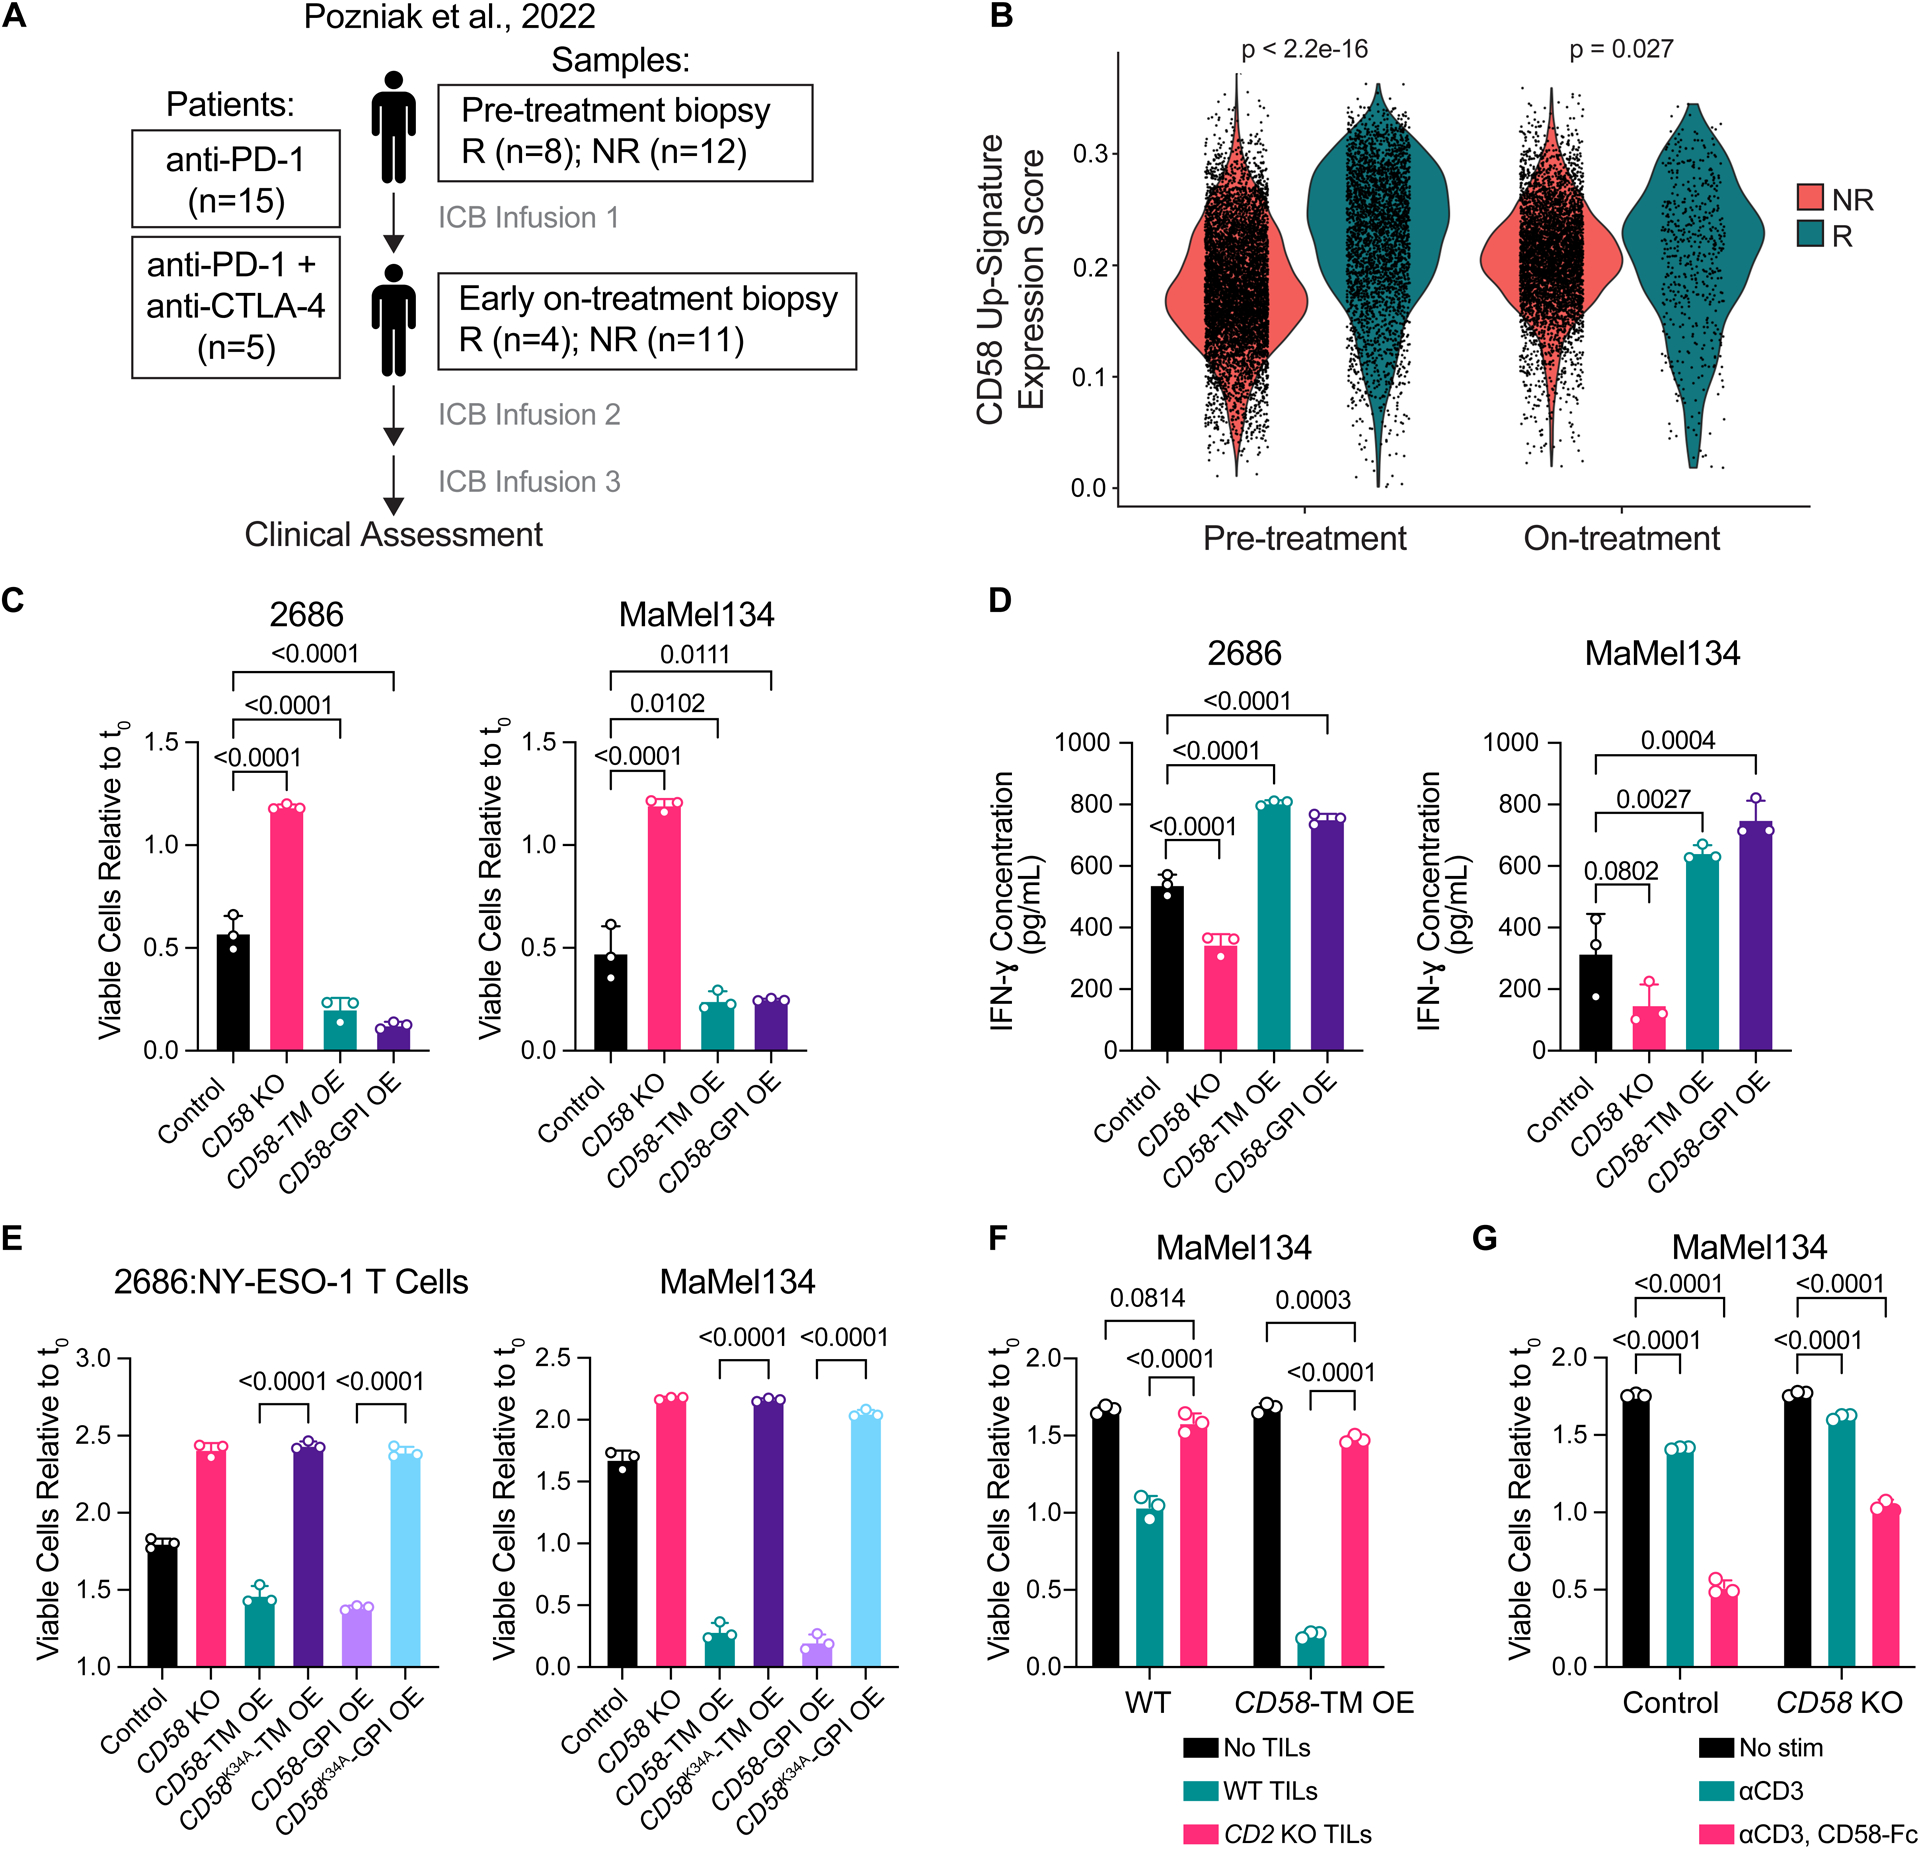
(A) Stage III/IV (AJCC 8th edition) melanoma patients were treated with nivolumab anti-PD-1 ± ipilimumab anti-CTLA-4. Cutaneous, subcutaneous, or lymph node metastases were biopsied prior to initial treatment and 2–3 weeks later shortly prior to the second treatment cycle. Clinical response (R, responders = complete or partial remission; NR, non-responders = stable or progressive disease) was assessed using RECISTv1.1 best overall response criteria.
(B) CD58 up-signature expression scores for malignant cells identified in scRNA-seq analysis of patient melanoma pre- and on-ICB-treatment biopsies from responders versus non-responders. (C-D) Fold change in number of viable 2686 and MaMel134 control, CD58 KO, and CD58-TM or CD58-GPI OE cells after 48 h or 72 h co-culture, respectively, with autologous TILs (C), and IFN-ɣ concentration within cleared media collected from co-cultures (D).
(E) Fold change in number of viable 2686 and MaMel134 control, CD58 KO, CD58-TM OE, CD58K34A-TM OE, CD58-GPI OE, or CD58K34A-GPI OE cells after 48 h co-culture with engineered NY-ESO-1-specific T cells or 72 h with autologous TILs, respectively.
(F) Fold change in number of viable MaMel134 control or CD58-TM OE cells after 48 h co-culture with or without WT or CD2 KO autologous TILs.
(G) MaMel134 TILs were stimulated for 48 h with 1 μg/mL OKT3 +/− 2 μg/mL CD58-Fc chimera prior to co-culturing with autologous melanoma cells; fold change in viable CD58 WT or KO melanoma cells shown after 48 h of co-culture.
Experiments performed in triplicate, with representative experiment shown of at least two independent experiments each (C-G). Statistical analysis performed using Wilcoxon rank sum test (B), one-way ANOVA with Tukey’s multiple comparisons test (C-E), and two-way ANOVA with Tukey’s multiple comparisons test (F,G). Data represent mean ± SD. Top and bottom of violin plots indicate minimum and maximum, respectively, and width represents frequency of values (B).