
Figure 5. CMTM6 binds to and promotes protein stability of CD58 via endosomal recycling.
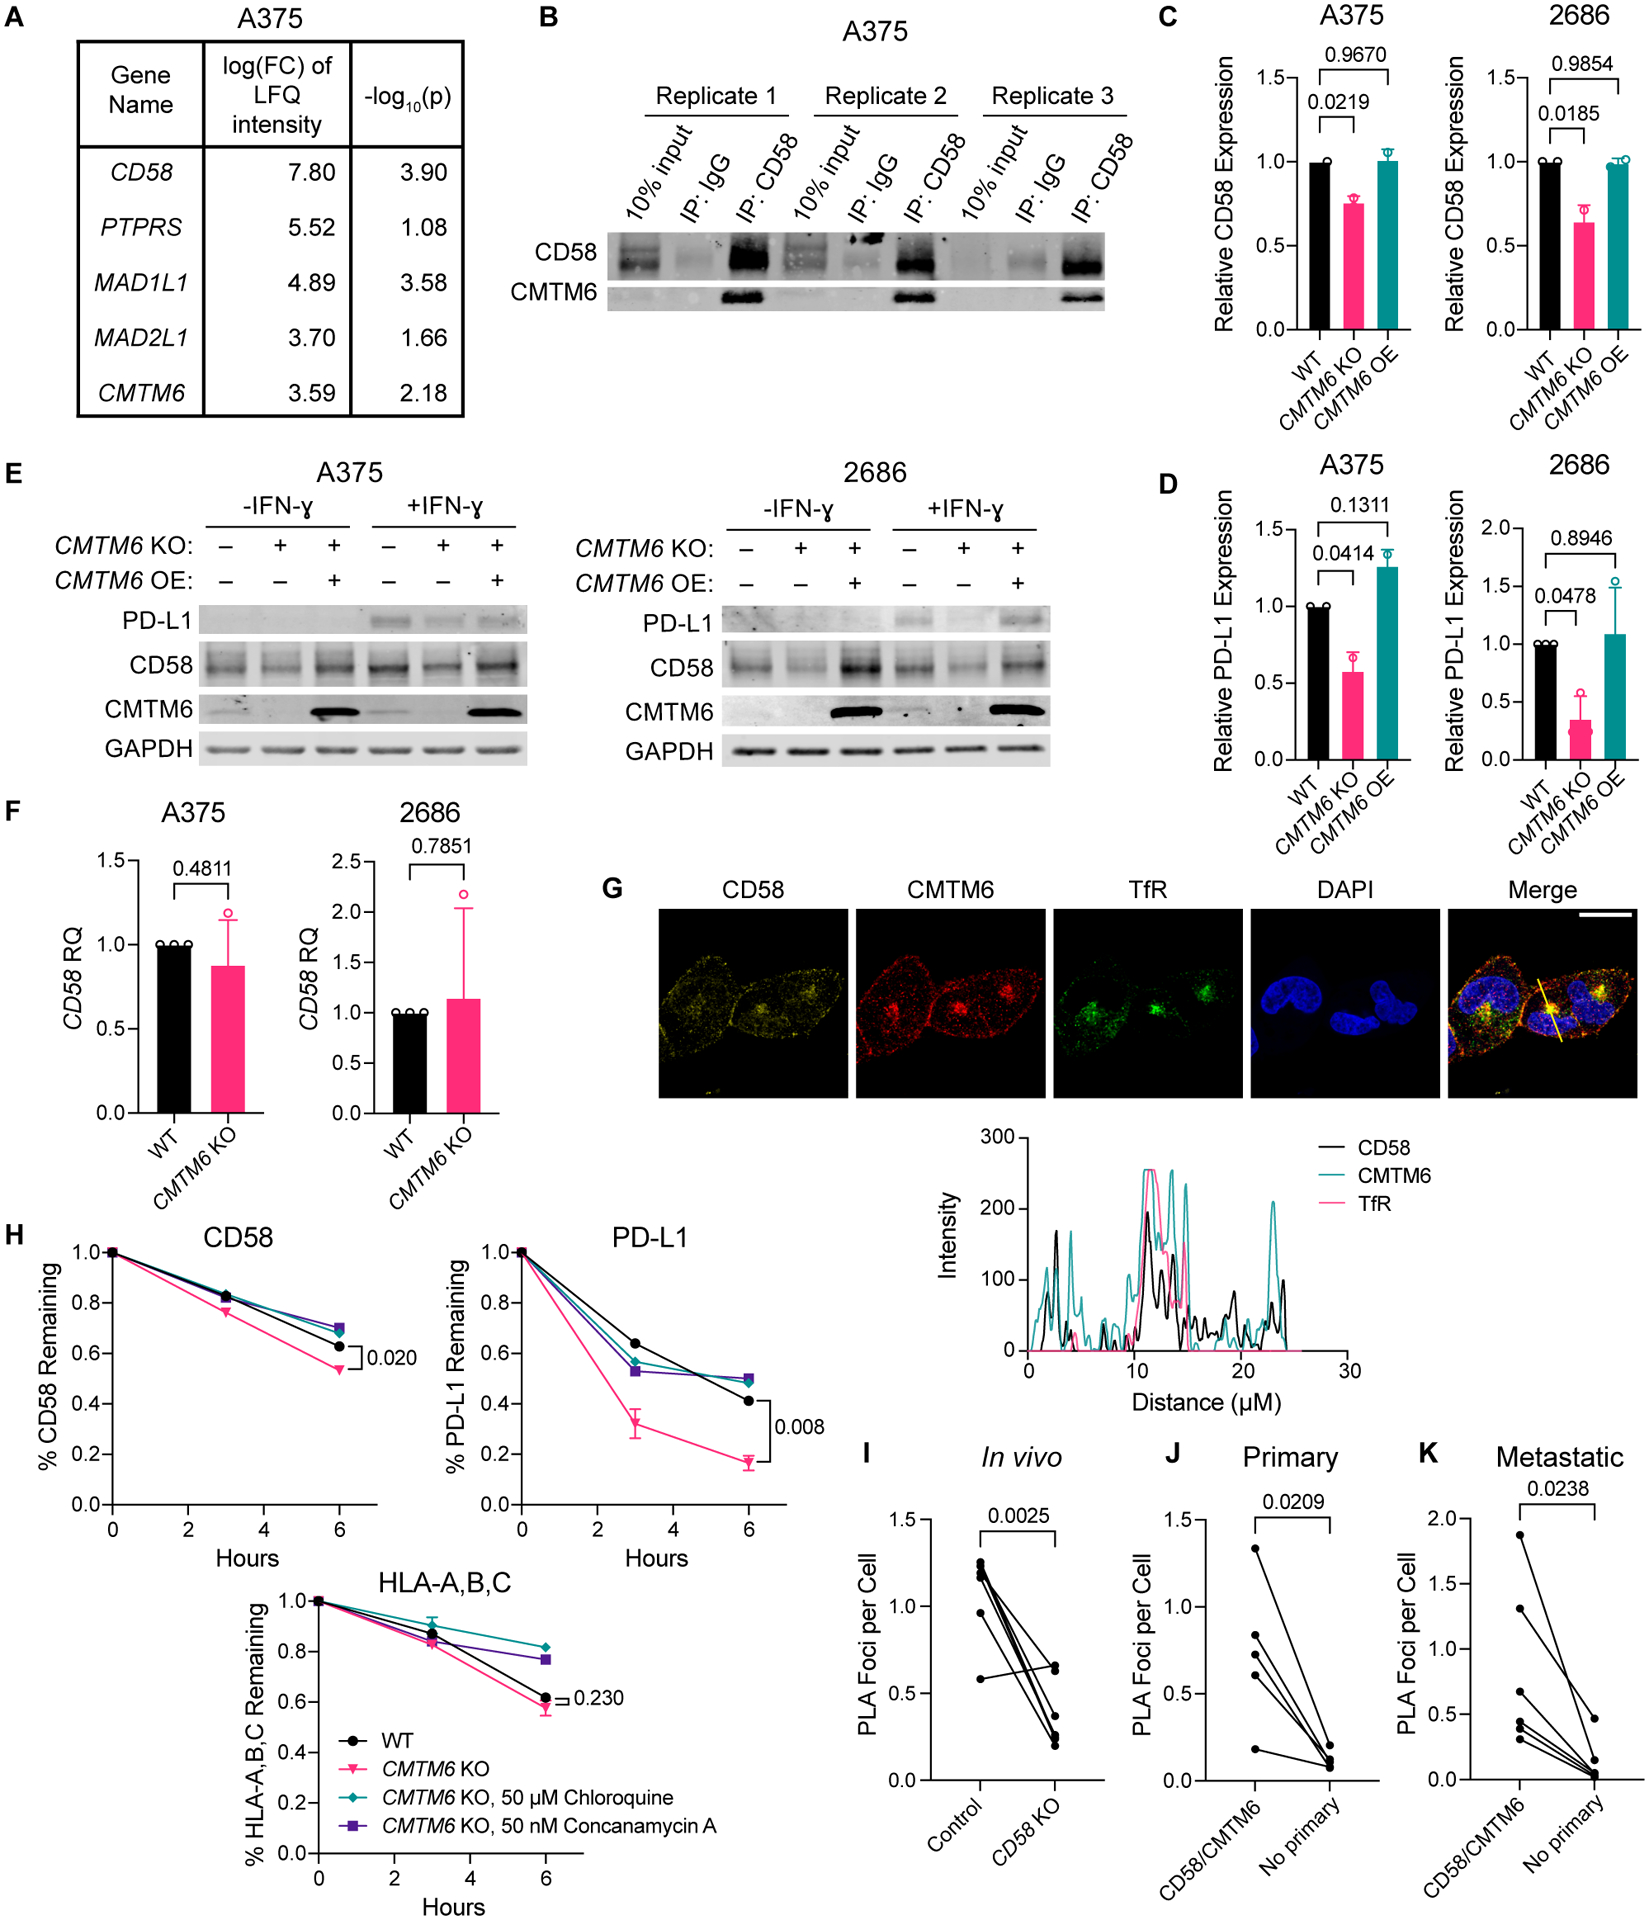
(A) Genes whose encoded proteins were enriched in CD58 IP versus IgG isotype IP lysates from A375 melanoma cells by mass spectrometry analysis. Inclusion criteria: FDR<0.05, log2 FC of LFQ intensity value >3, and an average spectral count within CRAPome database <2 to exclude background contaminants49. Experiment was performed with three biological replicates.
(B) Immunoblotting for CD58 and CMTM6 of A375 CD58 IP lysates used for IP-MS analysis. (C-D) Cell surface expression of CD58 (C) and PD-L1 (D) in A375 and 2686 WT, CMTM6 KO, and CMTM6 OE cells as assessed by flow cytometry.
(E) Immunoblotting for PD-L1, CD58, and CMTM6 in A375 and 2686 WT, CMTM6 KO, and CMTM6 OE cells after 72 h with or without 10 ng/mL IFN-ɣ.
(F) Relative gene expression of CD58 in A375 and 2686 WT or CMTM6 KO cells.
(G) 2686 WT cells were fixed and stained for CD58, CMTM6, and transferrin receptor (TfR), a marker of recycling endosomes, and analyzed by confocal microscopy. Profile plots of relative fluorescence intensity along yellow line shown at bottom. Scale bar = 20 μm.
(H) 2686 WT and CMTM6 KO cells were stained for cell surface CD58, PD-L1, and HLA-A,B,C with fluorophore-conjugated antibodies following 72 h with 10 ng/mL IFN-ɣ stimulation, and then incubated at 37 °C for 3–6 h to allow for recycling of antibody-bound cell surface proteins in the presence or absence of lysosomal inhibitors chloroquine or concanamycin A. Remaining CD58, PD-L1, and HLA-A,B,C expression was assessed by flow cytometry.
(I-K) Number of PLA foci representing CD58/CMTM6 interactions per cell in FFPE sections of CD58 WT versus KO tumors from mice shown in Figure 2A (I; n=7 each) and from patient primary (J; n=5) and metastatic (K; n=6) melanoma samples.
Experiments performed in duplicate, with independent experiments shown (C-D). Representative images shown from two independent experiments (E, G). Experiments performed with four technical replicates, with three independent experiments shown (F). Experiments performed in duplicate, with representative experiment shown from two independent experiments (H). Statistical analysis performed using one-way ANOVA with Tukey’s multiple comparisons test (C, D) and two-sided unpaired (F, H) or paired (I-K) T-tests. Data represent mean ± SD.