
Figure 4.
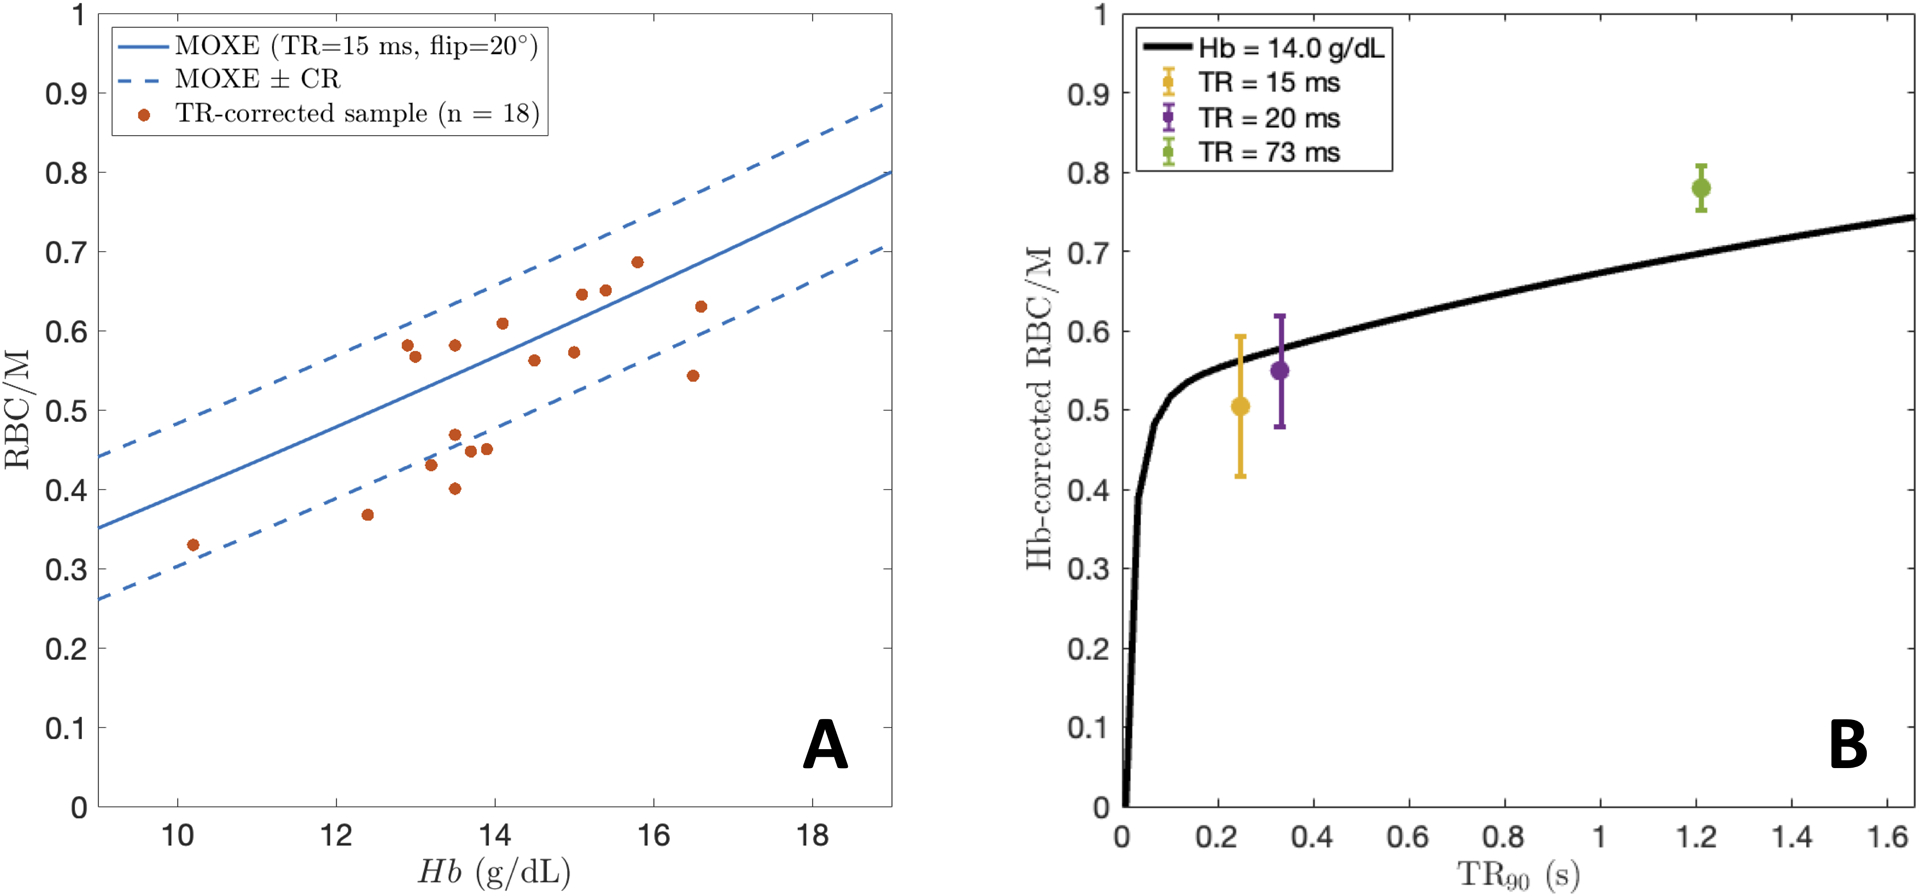
A: Non Hb-adjusted RBC/M values at TR=15 ms and 20° flip from the healthy cohort plotted vs Hb, along with the MOXE-predicted curve. RBC/M from MOXE±CR for RBC/M is plotted over the data. B: Distributions of Hb-adjusted RBC/M values measured at three different TRs (15, 20, and 73 ms). The black line depicts the RBC/M curve predicted by MOXE at .