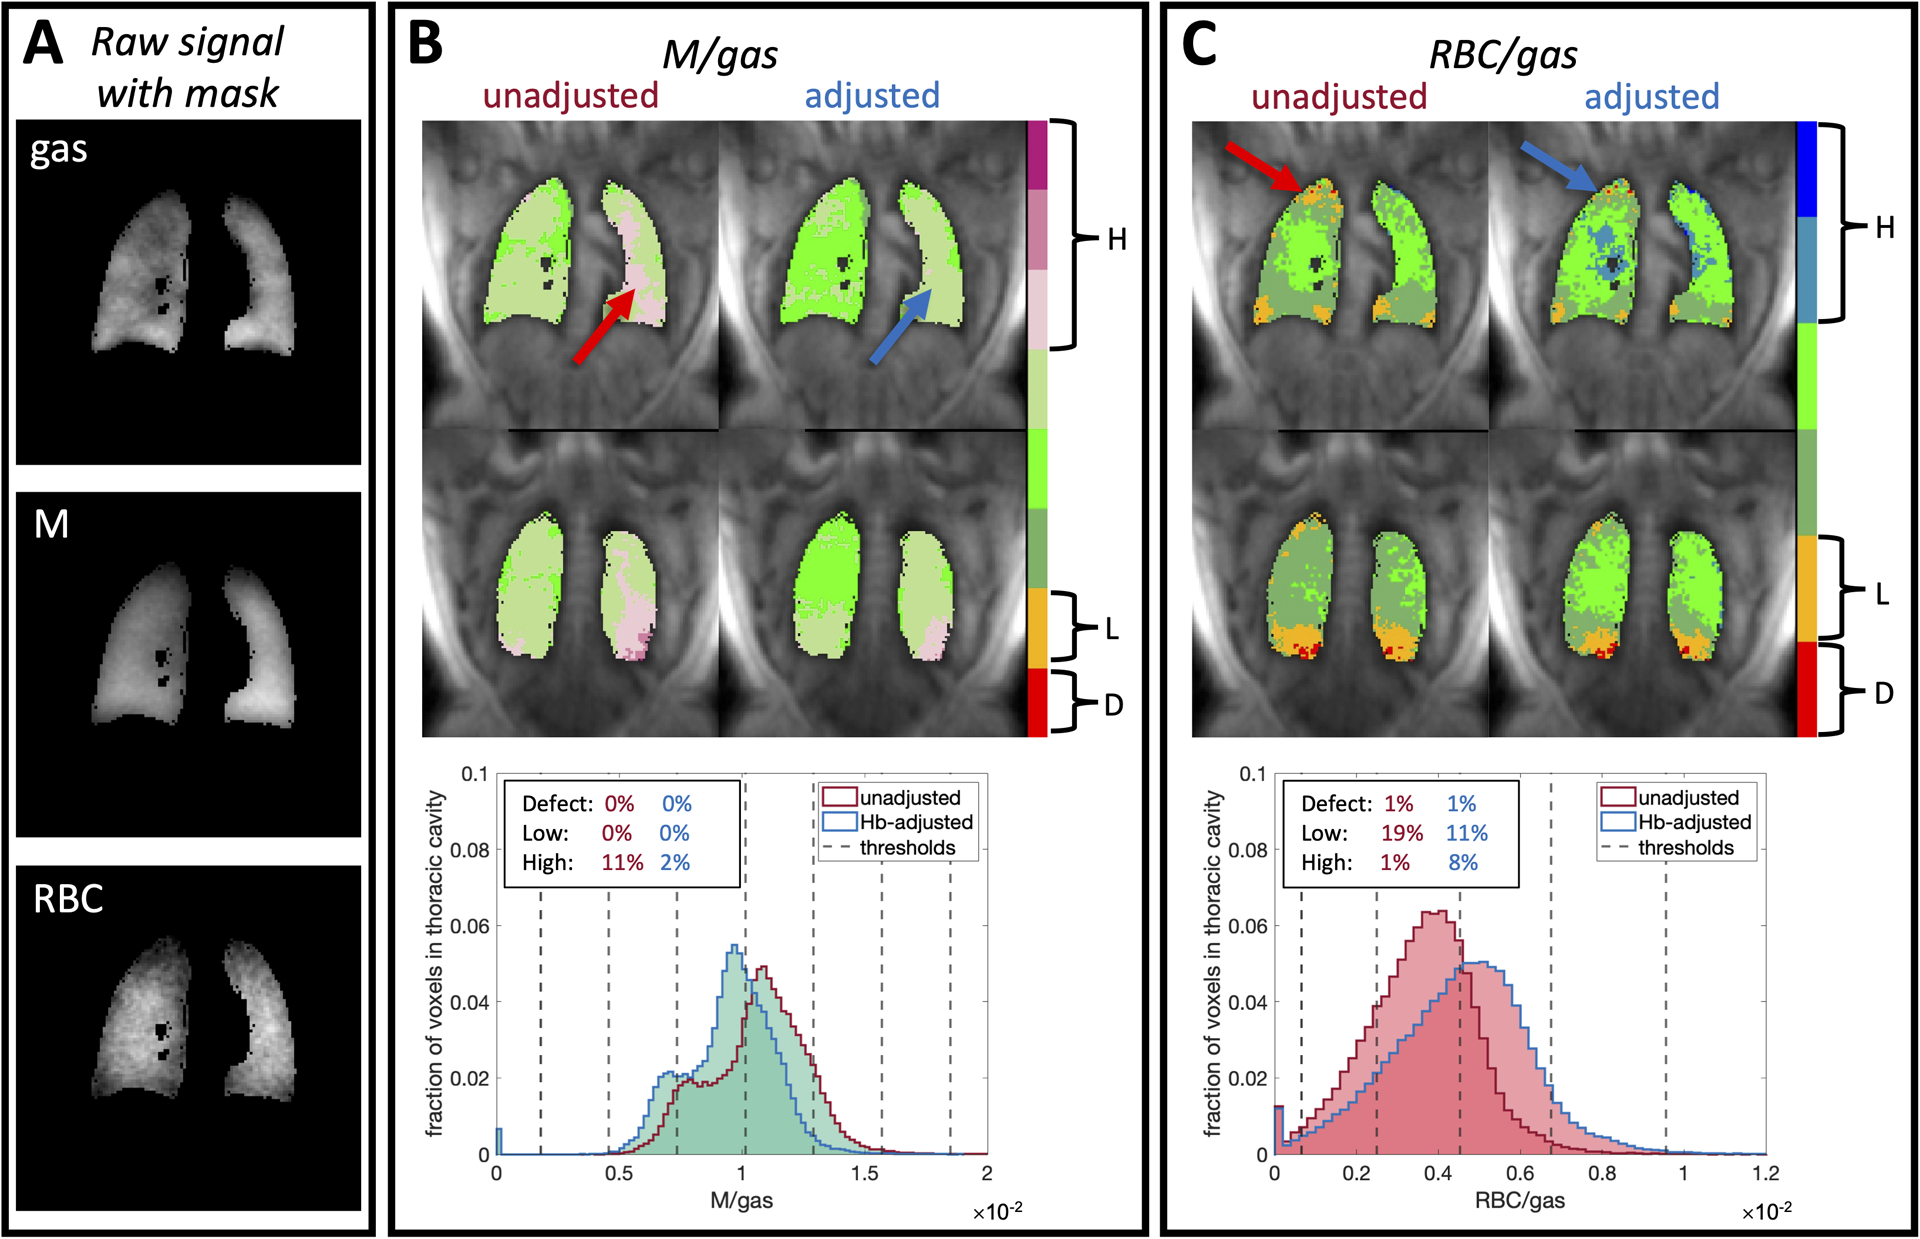
Figure 6.

Representative images of gas, M, and RBC after application of a thoracic cavity mask (A) for a healthy subject with Hb=10.2 g/dL along with the application of Hb adjustment factors to the 3D gas exchange maps of M/gas (B) and RBC/gas (C). We also show the changes in voxel intensity distributions and defect (D), low (L), and high (H) percentages along with the thresholds that define the color bins. The subject’s low Hb causes membrane uptake to be over-estimated, while RBC transfer is underestimated. After adjusting the images to , the apparent high membrane uptake decreases from 11% to 2%, while low RBC transfer decreases from 19% to 11%. Arrows indicate regions where particularly high membrane uptake and low RBC transfer are resolved after adjustment. Notably, this subject’s RBC/M ratio increases by ~40% from 0.38 to 0.53 after adjustment.
