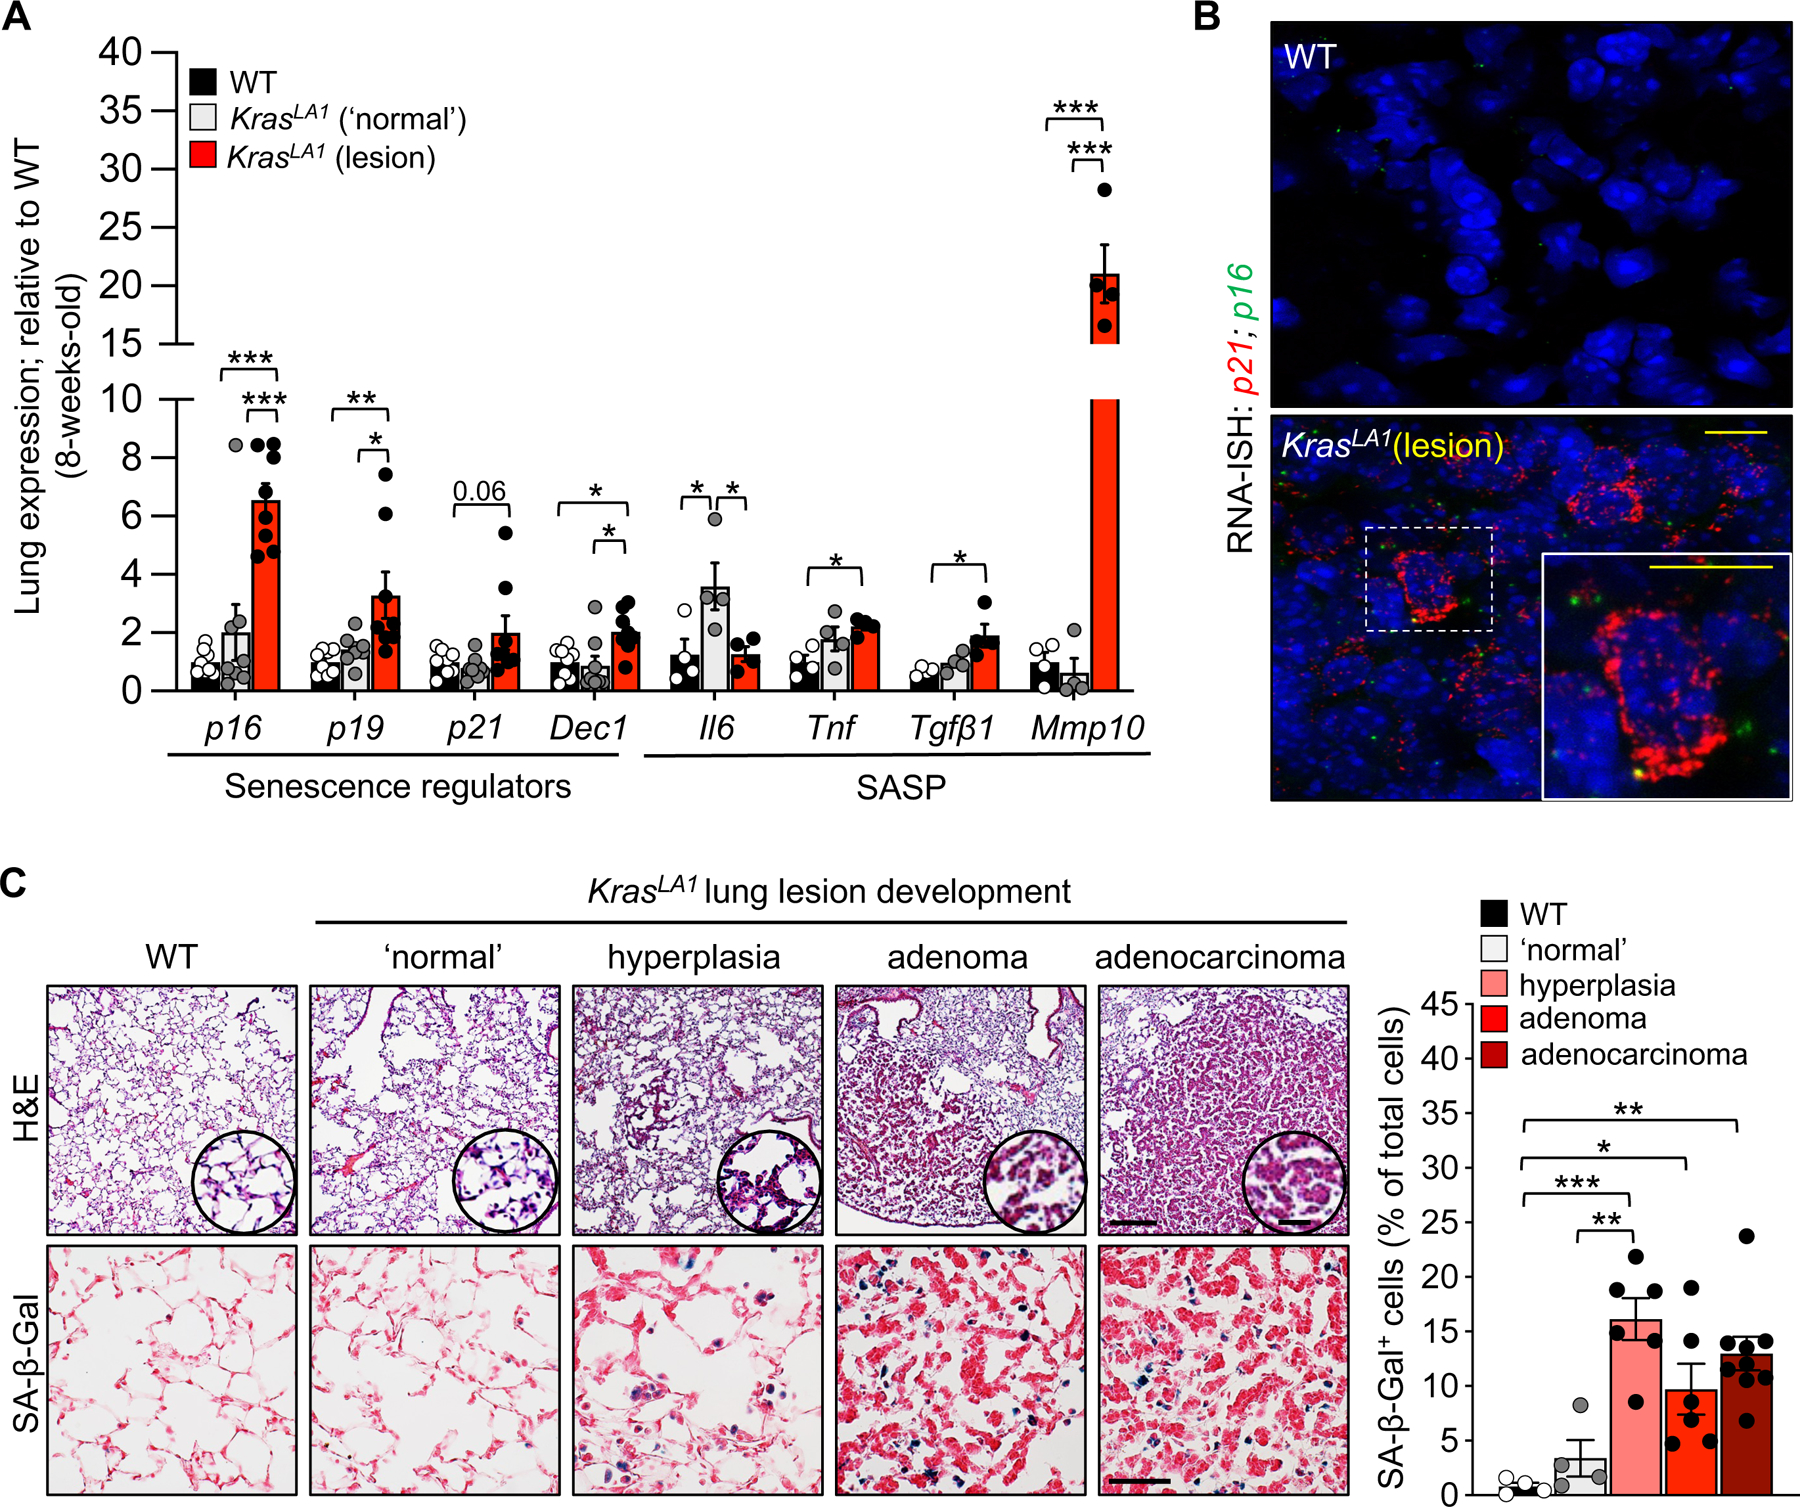
Figure 1: Proinflammatory senescent cells accumulate in the lungs of KrasLA1 mice.

(A) Senescence-associated gene expression in 8-week-old wild-type (WT), KrasLA1 ‘normal’ (no lesion), and KrasLA1 lung lesion areas.
(B) Representative images of RNA in situ hybridization (RNA-ISH) to Cdkn1a (p21) and Cdkn2a (p16).
(C) Representative images of hematoxylin and eosin (upper, left) and senescence-associated β-galactosidase (SA-β-gal, lower, left) staining in WT lung and throughout KrasLA1 lung lesion development. Quantification of SA-β-gal staining (right).
Scale bars: [10μm (inset 5μm) B], [H&E 200μm (inset 25μm), SA-β-Gal 50μm C]. Data are means ± SEM. *P<0.05; **P<0.01; ***P<0.001; (one-way ANOVA with Tukey’s multiple comparison test in A, C).
