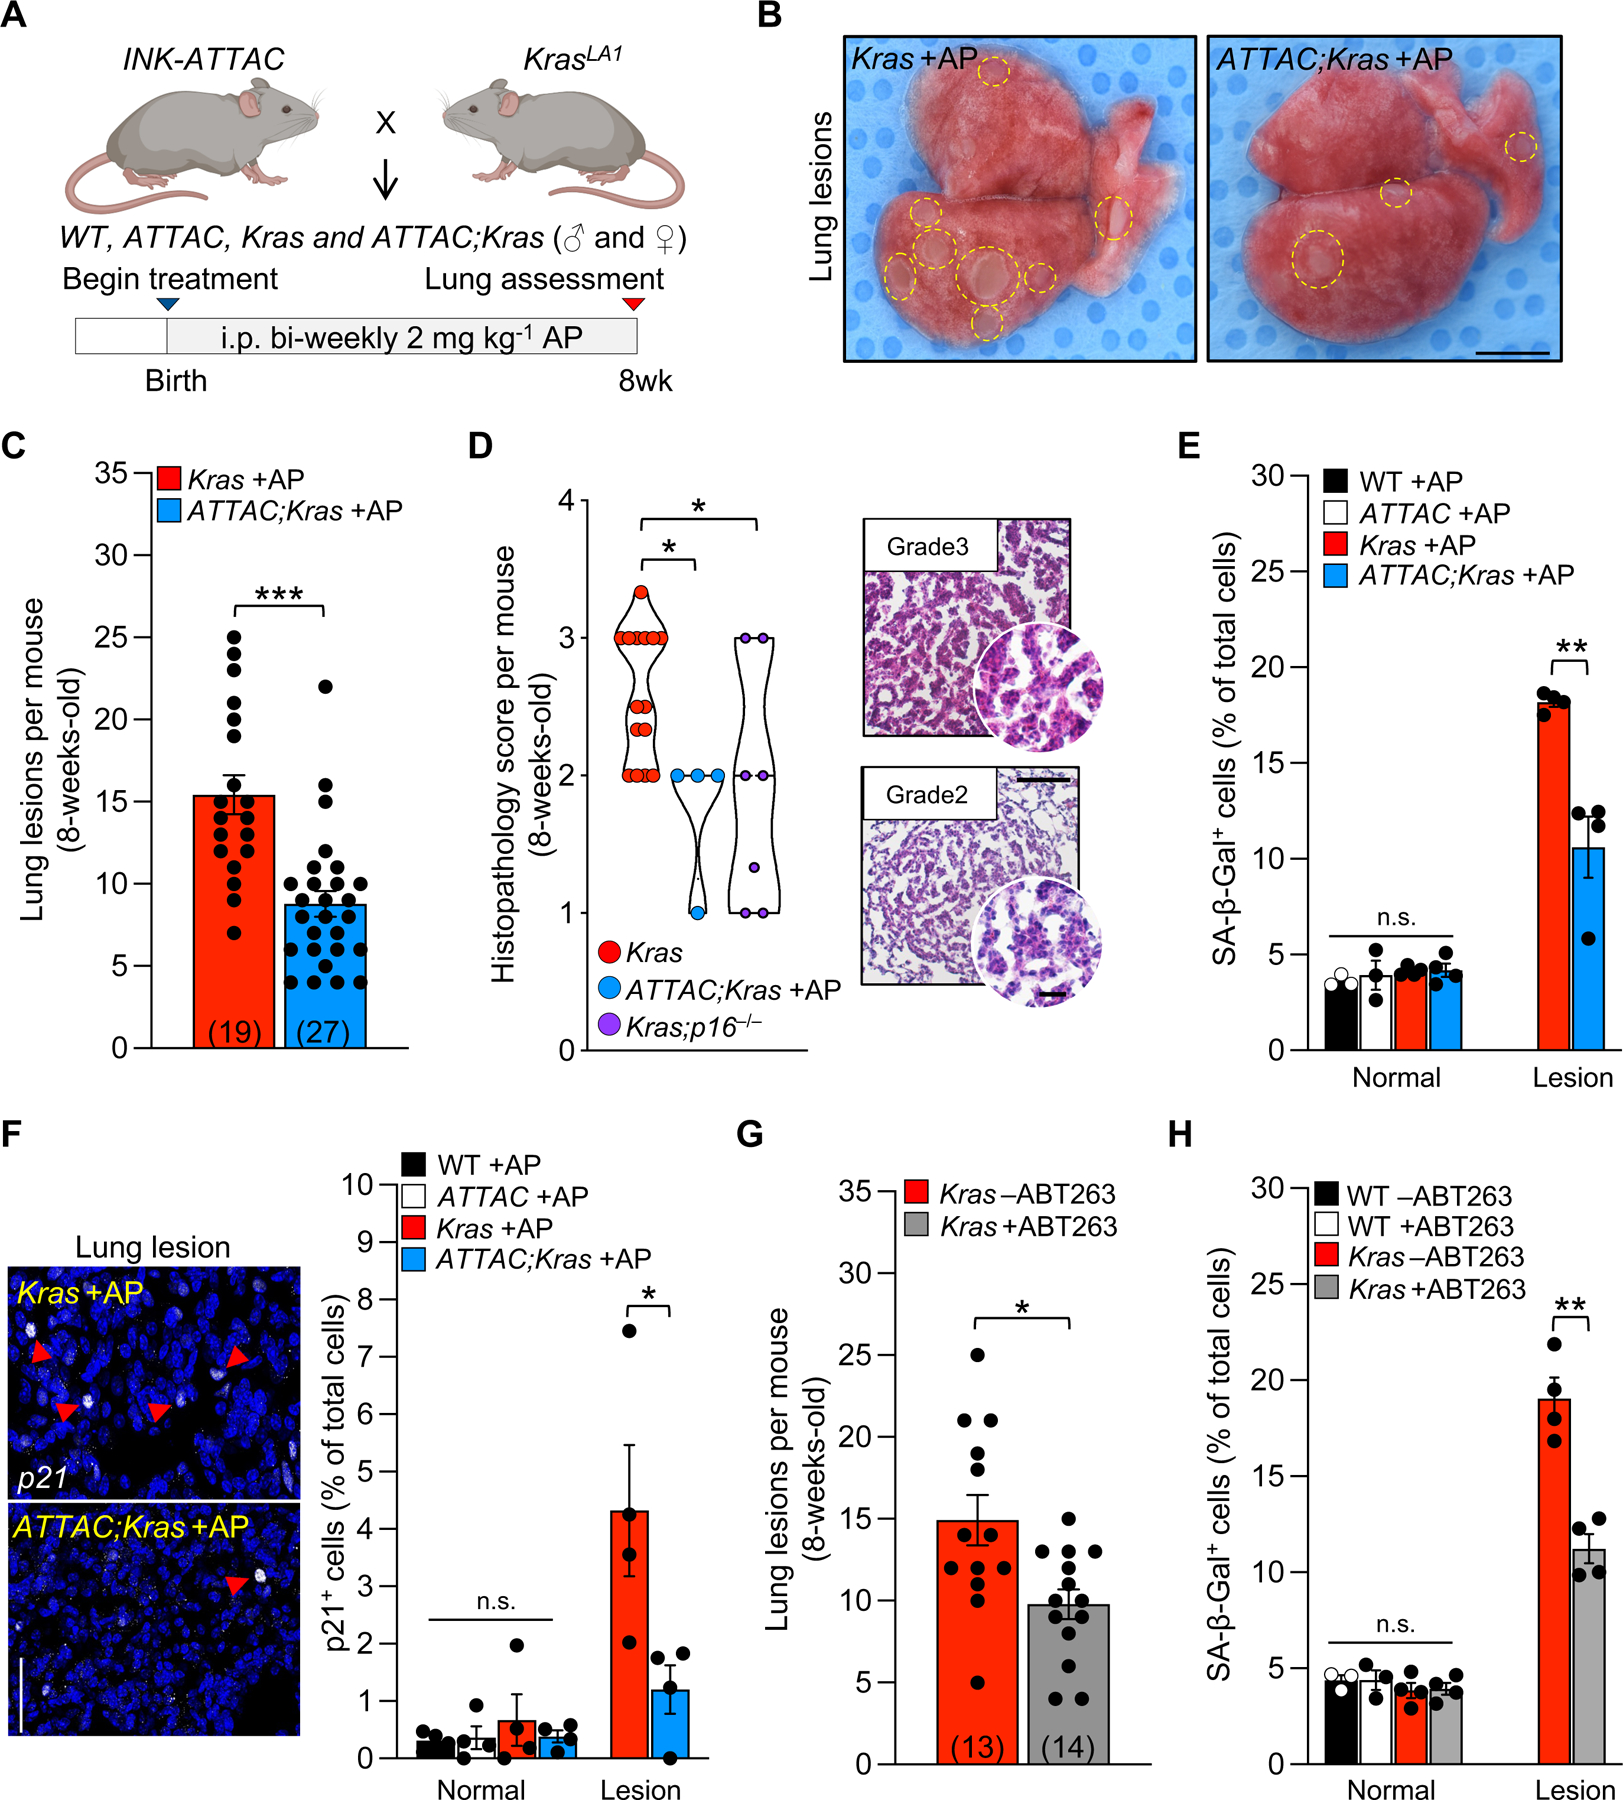
Figure 2: Removal of senescent cells in Kras mice delays tumorigenesis.

(A) Study design for the ‘prevention’ strategy to remove of senescent cells in ATTAC;Kras mice from birth to eight weeks.
(B) Representative images of lung lesions.
(C) Number of lung lesions per mouse. The number of mice per group are indicated in the parenthesis.
(D) Histopathology score (left) and representative images (right) of H&E-stained lung lesions.
(E) Percentage of SA-β-Gal+ cells in normal and lesion area.
(F) Representative images (left) and quantification (right) of immunostaining for p21.
(G) Number of lung lesions in mice treated with vehicle (−ABT263) or ABT263 (+ABT263). The number of mice per group are indicated in the parenthesis.
(H) Frequency of SA-β-Gal+ cells after vehicle or ABT263 treatment.
Scale bars: 10mm (B), [100μm, inset 20μm (D)], 50μm (F). Data are means ± SEM. ns, non-significant. *P<0.05; **P<0.01; ***P<0.001; [unpaired two-tailed Mann-Whitney test in D, one-way ANOVA with Tukey’s multiple comparison test in E, F, H (normal area), and unpaired two-tailed Student’s t test in C, and E, F, H (lesion area)].
See Figure S1.
