
Figure 3: Single-cell transcriptional profiling of Kras lungs identifies signatures of cellular senescence in p16-expressing macrophages.
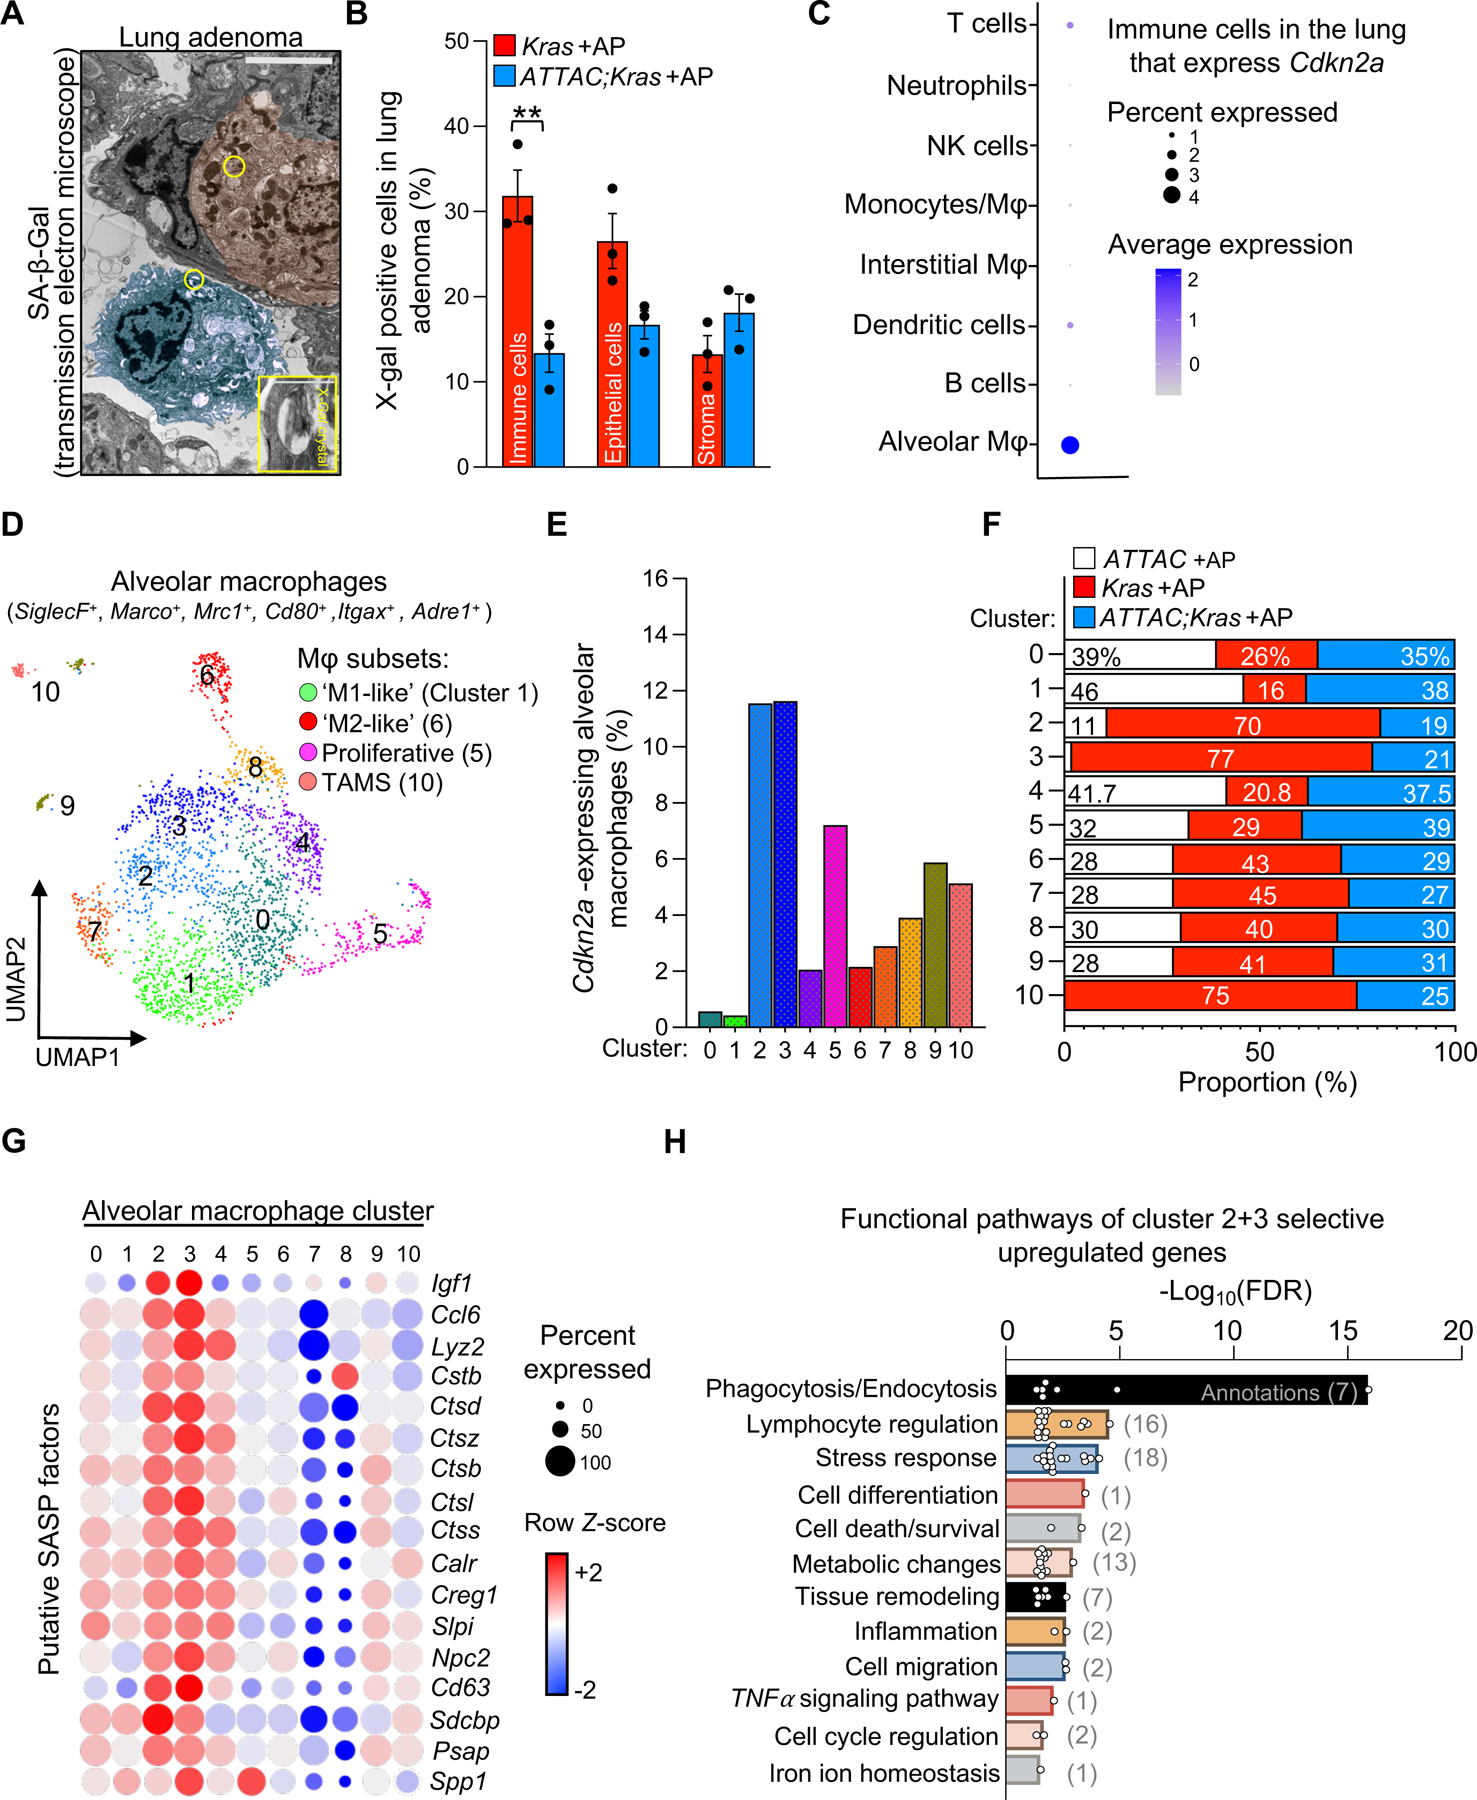
(A) Transmission electron micrograph of an X-Gal+ crystal in an epithelial cell (red) and immune cell (blue) in an 8-week-old Kras mouse.
(B) Percentage of X-gal+ immune, epithelial, and stromal cells in lesions of eight-week-old Kras and ATTAC;Kras mice treated with AP from birth.
(C) Cdkn2a (p16) expression in immune cell types from eight-week-old ATTAC +AP, Kras +AP, and ATTAC;Kras +AP mice.
(D) UMAP plot displaying 11 cell clusters of alveolar macrophages.
(E) Percentage of alveolar macrophages expressing Cdkn2a (p16) in each cluster.
(F) Proportion of alveolar macrophages from each genotype per cluster.
(G) Bubble plot of alveolar macrophages displaying putative SASP factors enriched in cluster 2/3.
(H) Selected functional annotation pathways that are enriched in cluster 2/3.
Scale bar: [5μm (inset 1μm) A]. Data are means ± SEM. ns; non-significant. *P<0.05; **P<0.01; ***P<0.001; (Unpaired two-tailed Student’s t test in B).