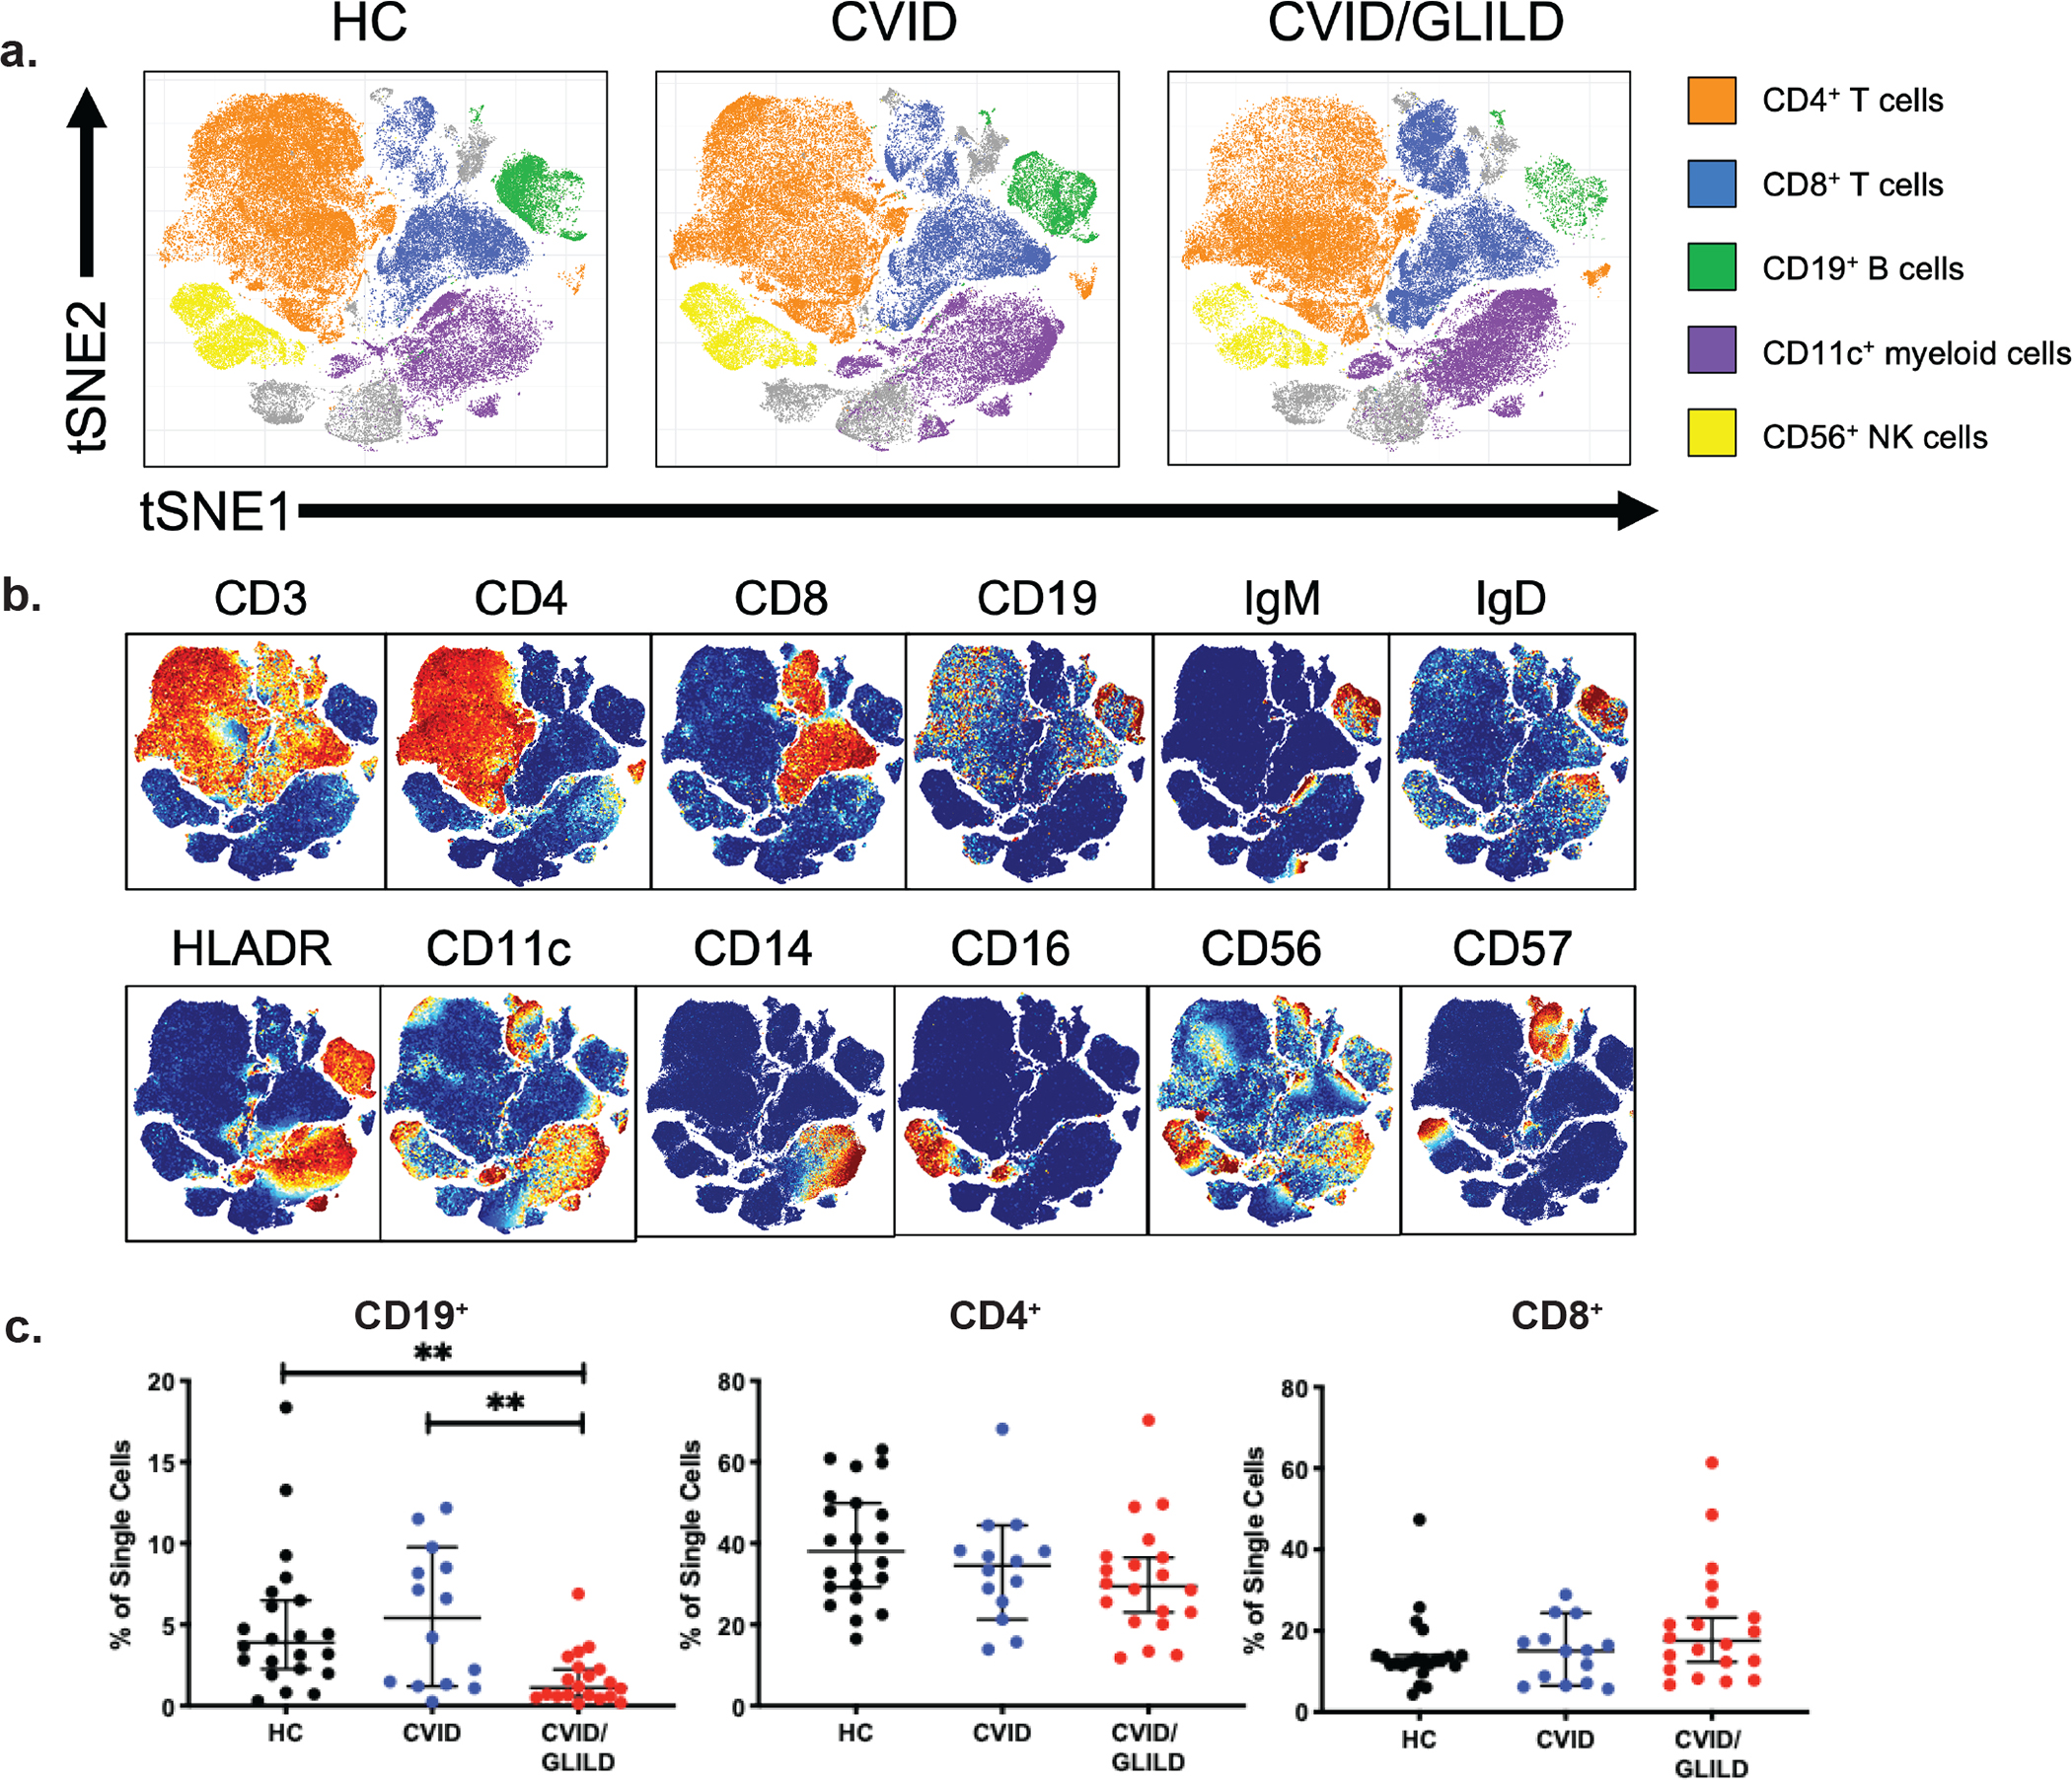
Fig. 1.

Major leukocyte populations revealed through PhenoGraph. Unsupervised PhenoGraph cluster map of single cells from HC, CVID, and CVID/GLILD groups (a). Stratification of single cell events based on surface marker expression (b). Percentages of lymphocyte populations identified through PhenoGraph analysis (c). Error bars represent median and 95% CI. *p < 0.05, **p < 0.01, ***p < 0.001, ****p < 0.0001. Not significant unless stated by asterisk in figure. Kruskal–Wallis accounting for multiple comparisons was used for statistical significance
