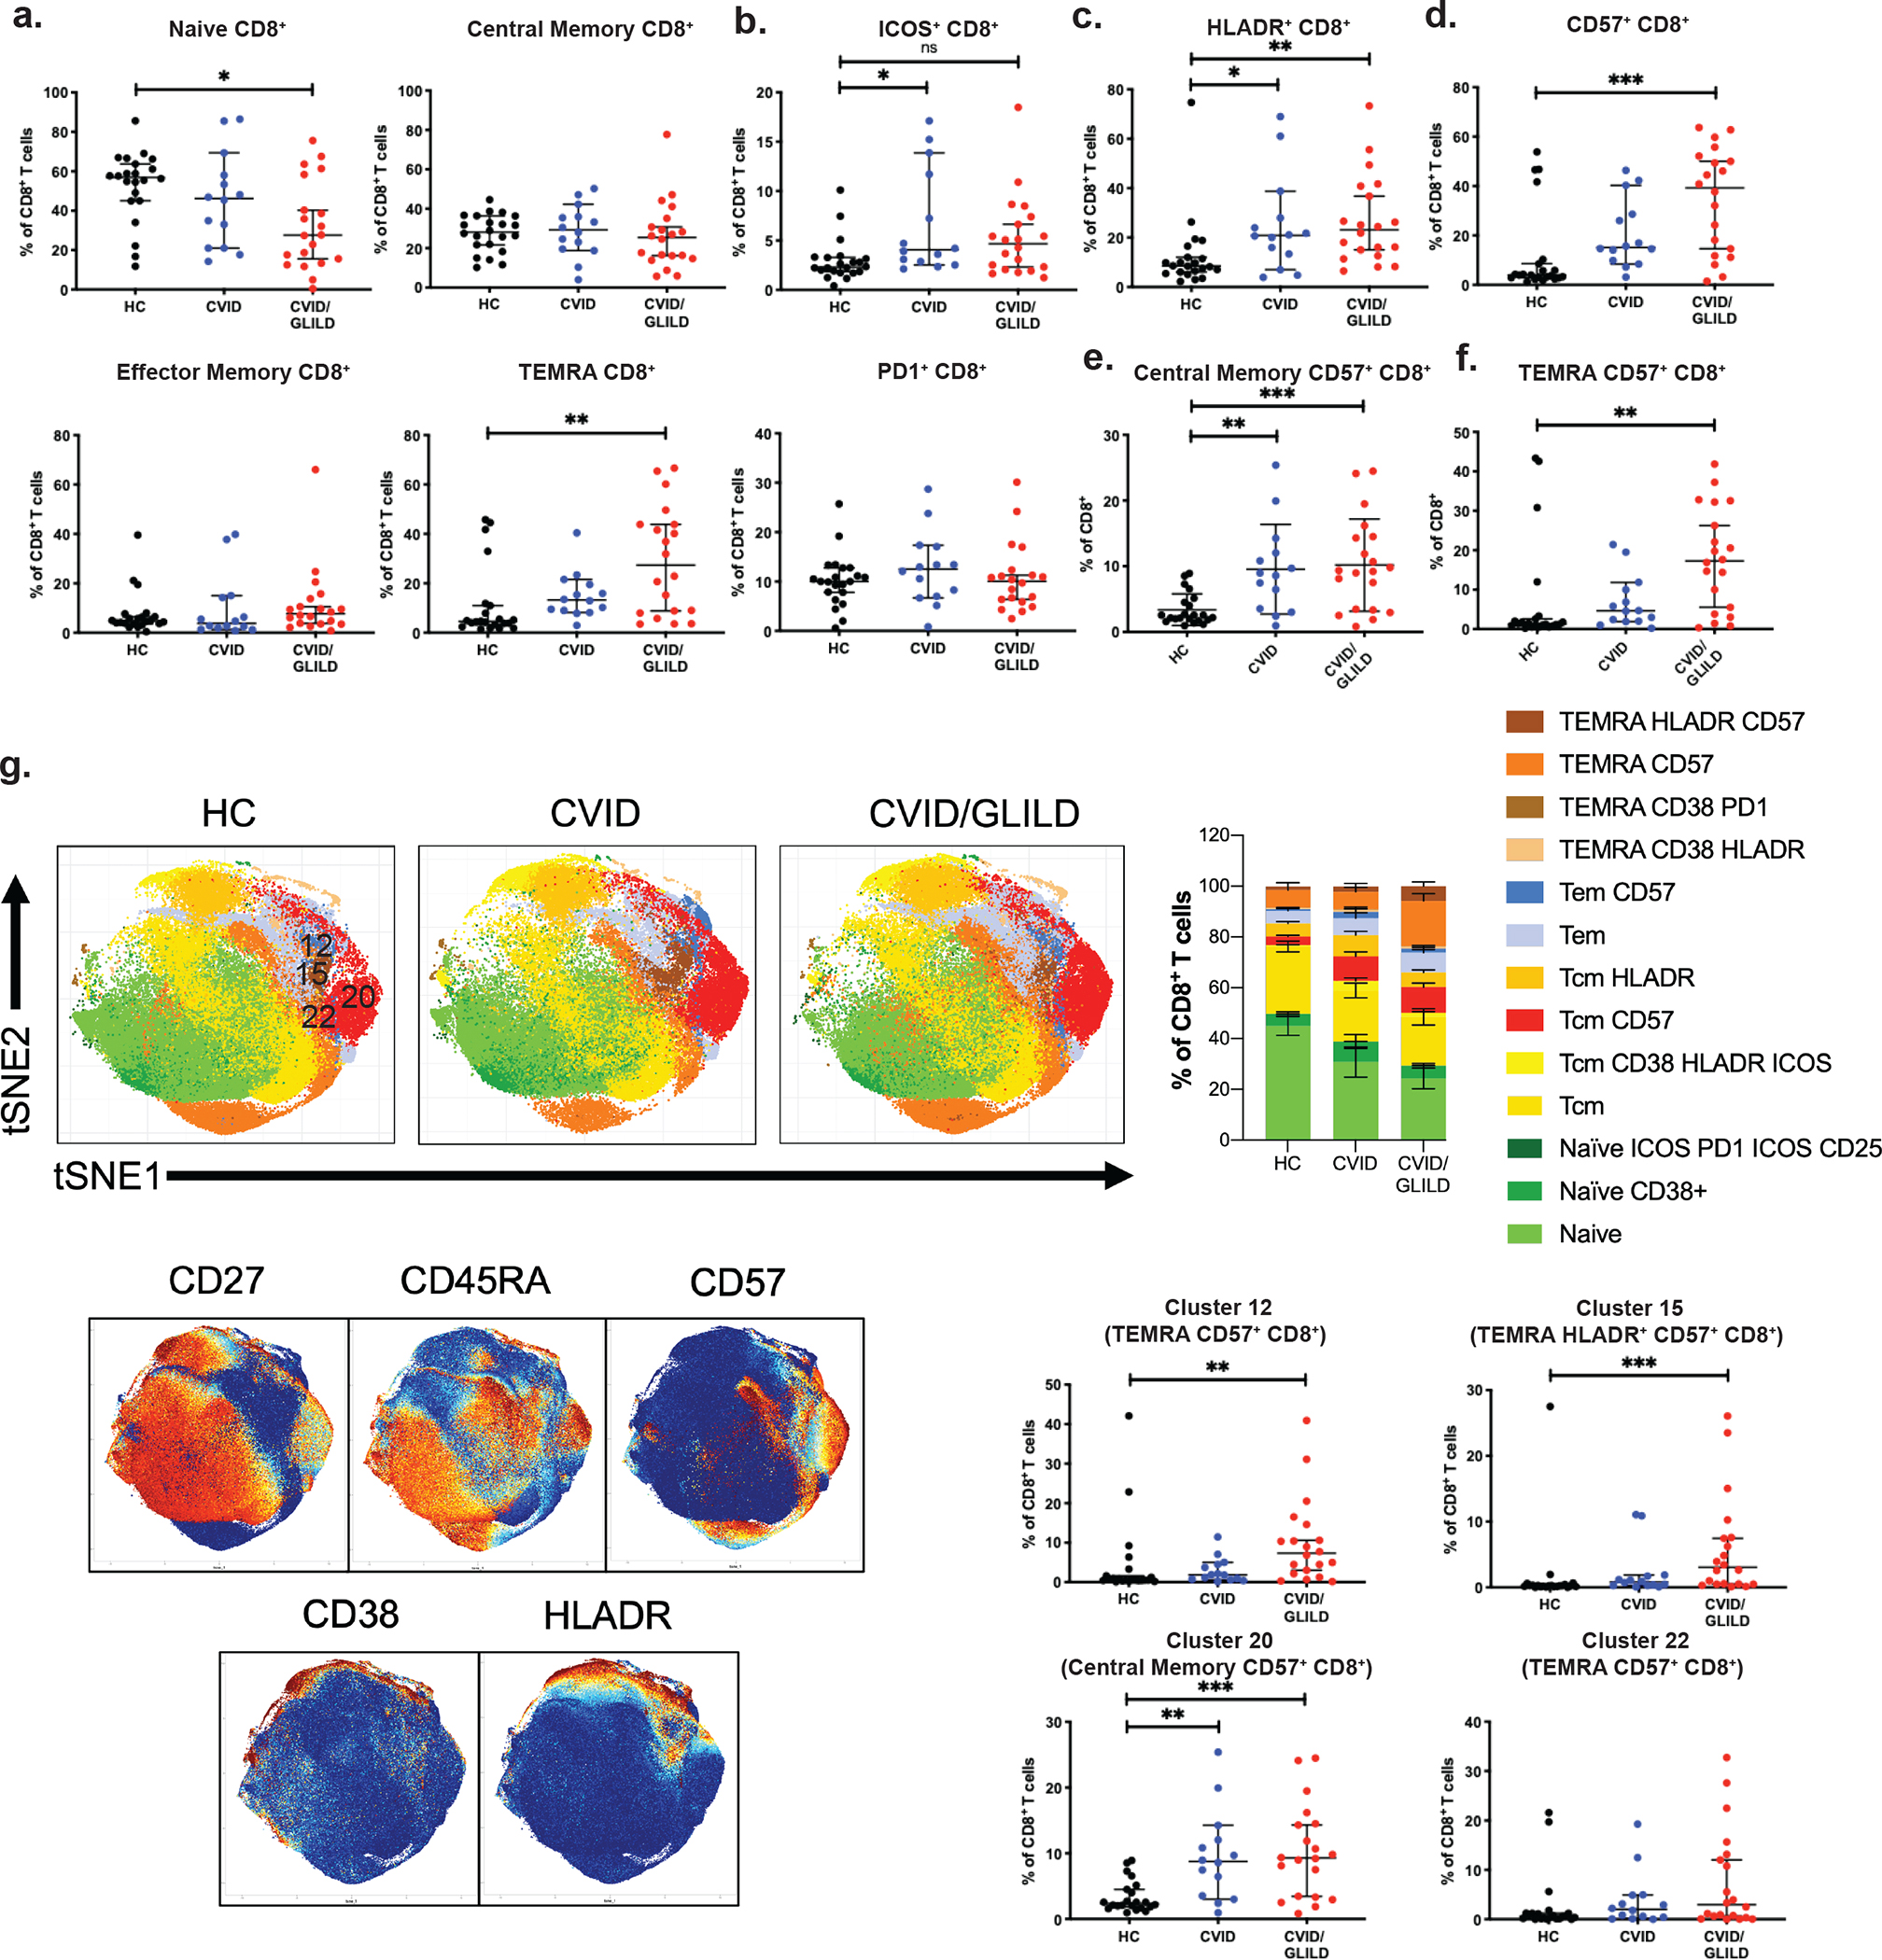
Fig. 4.

CVID/GLILD patients exhibit increased frequency of exhausted CD57+ CD8+ T cells. Percentages of CD8 T cell populations derived from manual gating of mass cytometry data for naïve CD8+ (a), central memory CD8+ (b), effector memory CD8 + (c), TEMRA CD8+ (d), ICOS+CD8+ (e), PD-1+CD8+ (f), HLADR+CD8+ (g), CD57 +CD8+ (h), naïve CD57+CD8+ (i), central memory CD57+CD8+ (j), effector memory CD57+CD8+ (k), and TEMRA CD57+CD8+ (l). Unsupervised PhenoGraph clustering of CD8+ single cell events (m), cluster map surface marker expression (n), and cluster frequencies corresponding to CD57+CD8+ TEMRA (cluster 12 and cluster 22), HLADR+CD57+CD8+ TEMRA (cluster 15), and CD57+CD8+ central memory (cluster 20) (o). Error bars represent median and 95% CI. *p < 0.05, **p < 0.01, ***p < 0.001, ****p < 0.0001. Not significant unless stated by asterisk in figure. Kruskal–Wallis accounting for multiple comparisons was used for statistical significance
