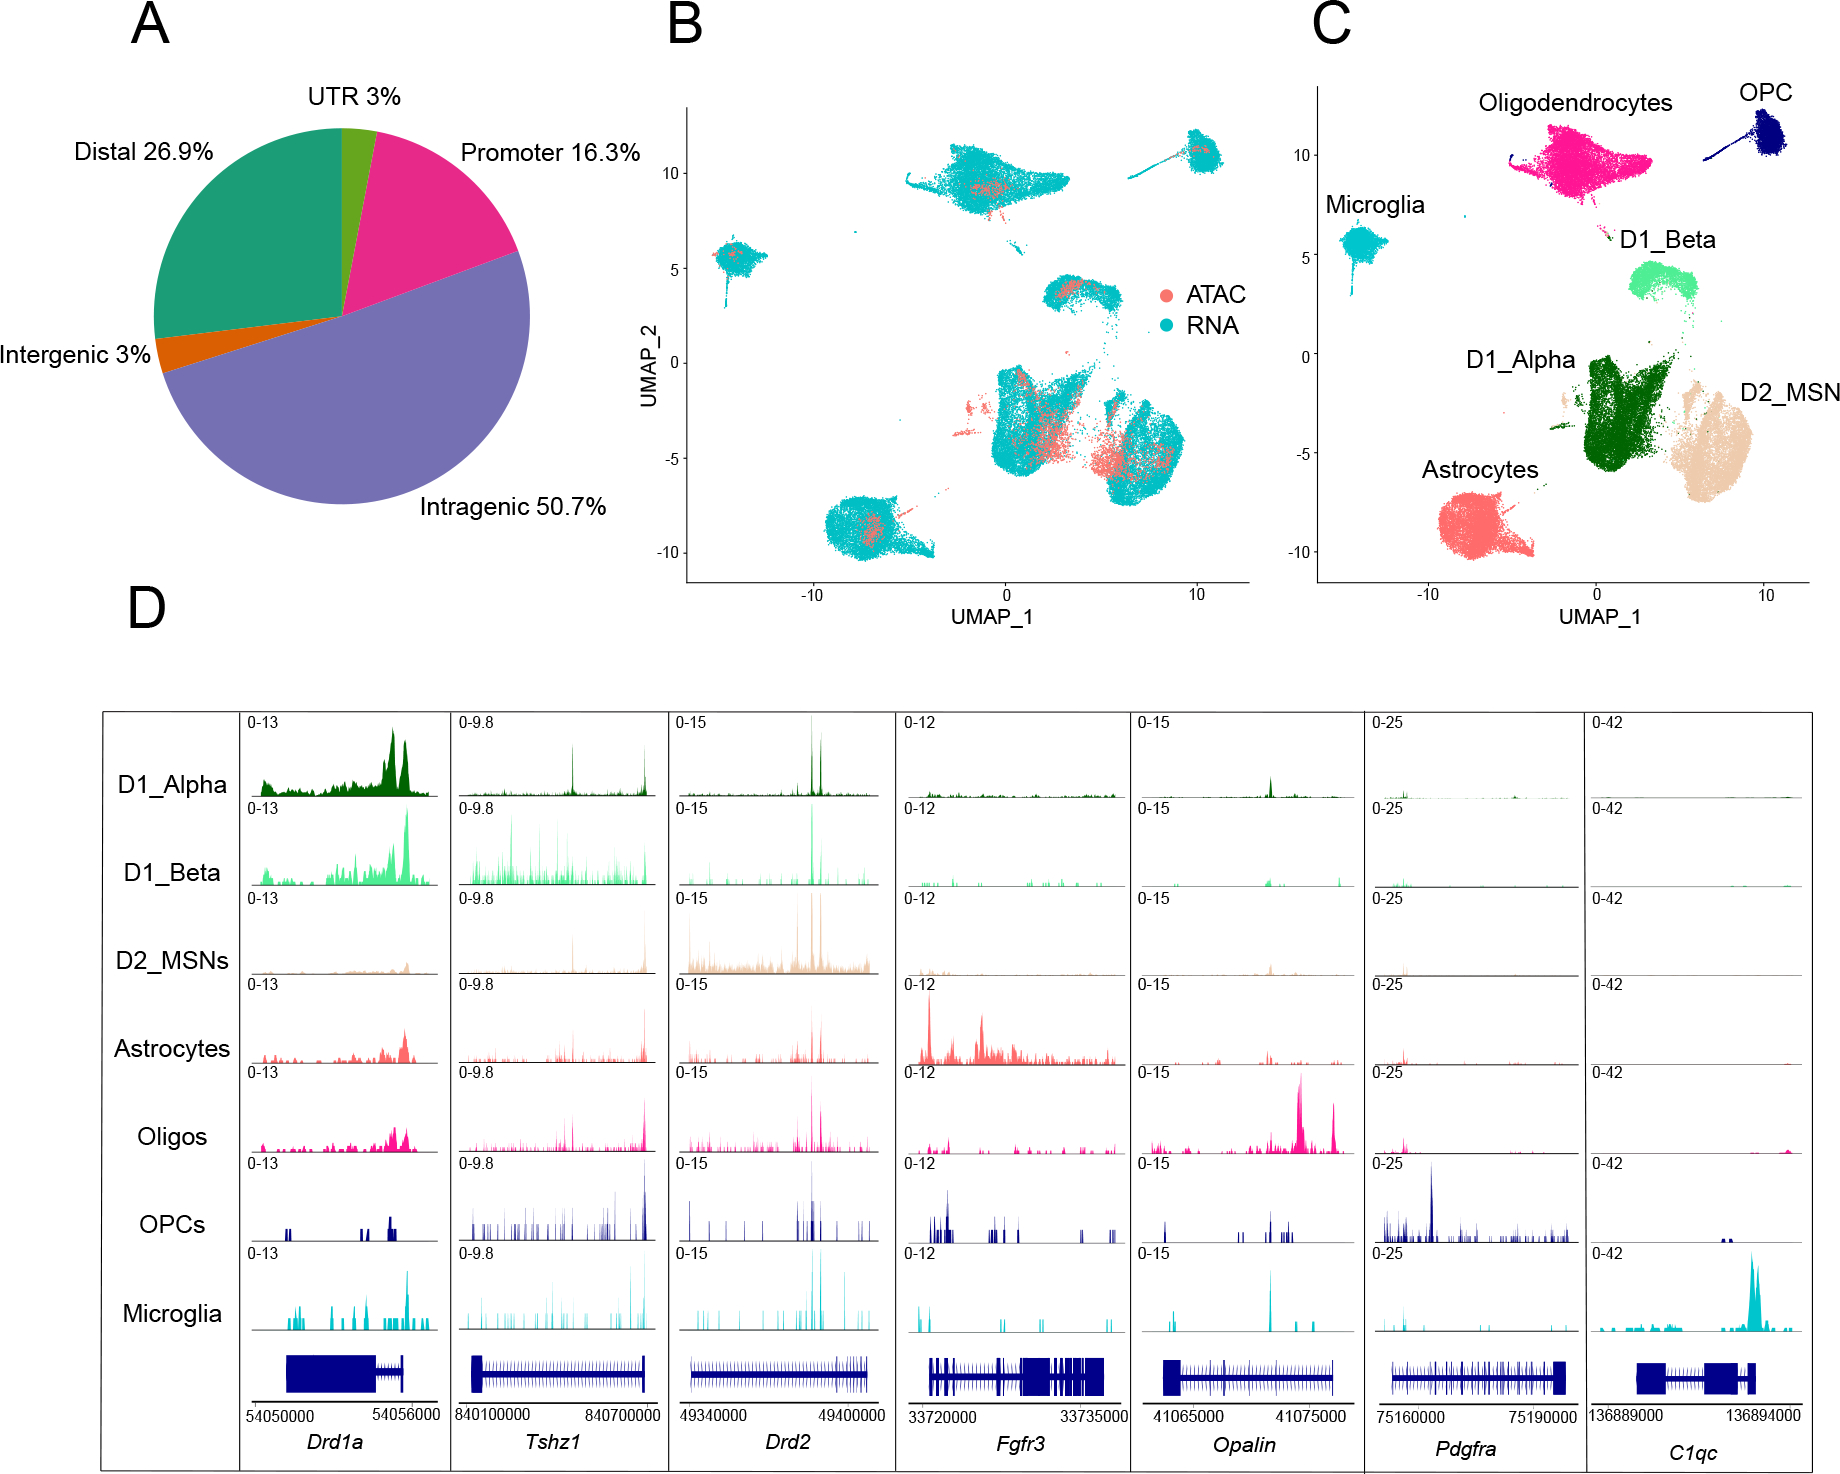
Figure 1.

A: Proportion of peaks mapping to promoter regions (−1000bp or +100bp from the TSS of gene), intragenic regions (within gene body excluding promoter and UTR regions), distal regions (<200kb upstream or downstream of TSS, excluding promoters), intergenic regions (>200kb upstream or downstream of TSS) and UTR regions.
B-C: UMAP plots of 3,449 mouse NAc nuclei profiled by snATAC-seq anchored to 41,433 NAc nuclei profiled by scRNA-seq. Nuclei are colored by profiling method (B) or cell-type classification (C). MSN = medium spiny neurons; Oligos = oligodendrocytes; OPC = oligo precursor cells.
D: Coverage plots for selected cell-type-specific marker genes for each NAc cell type (rows). Chromatin accessibility is displayed at cell-type-specific genes (columns), which is displayed as the average frequency of sequenced DNA fragments per cell for each cell type; y axis is scaled for each gene (column).
