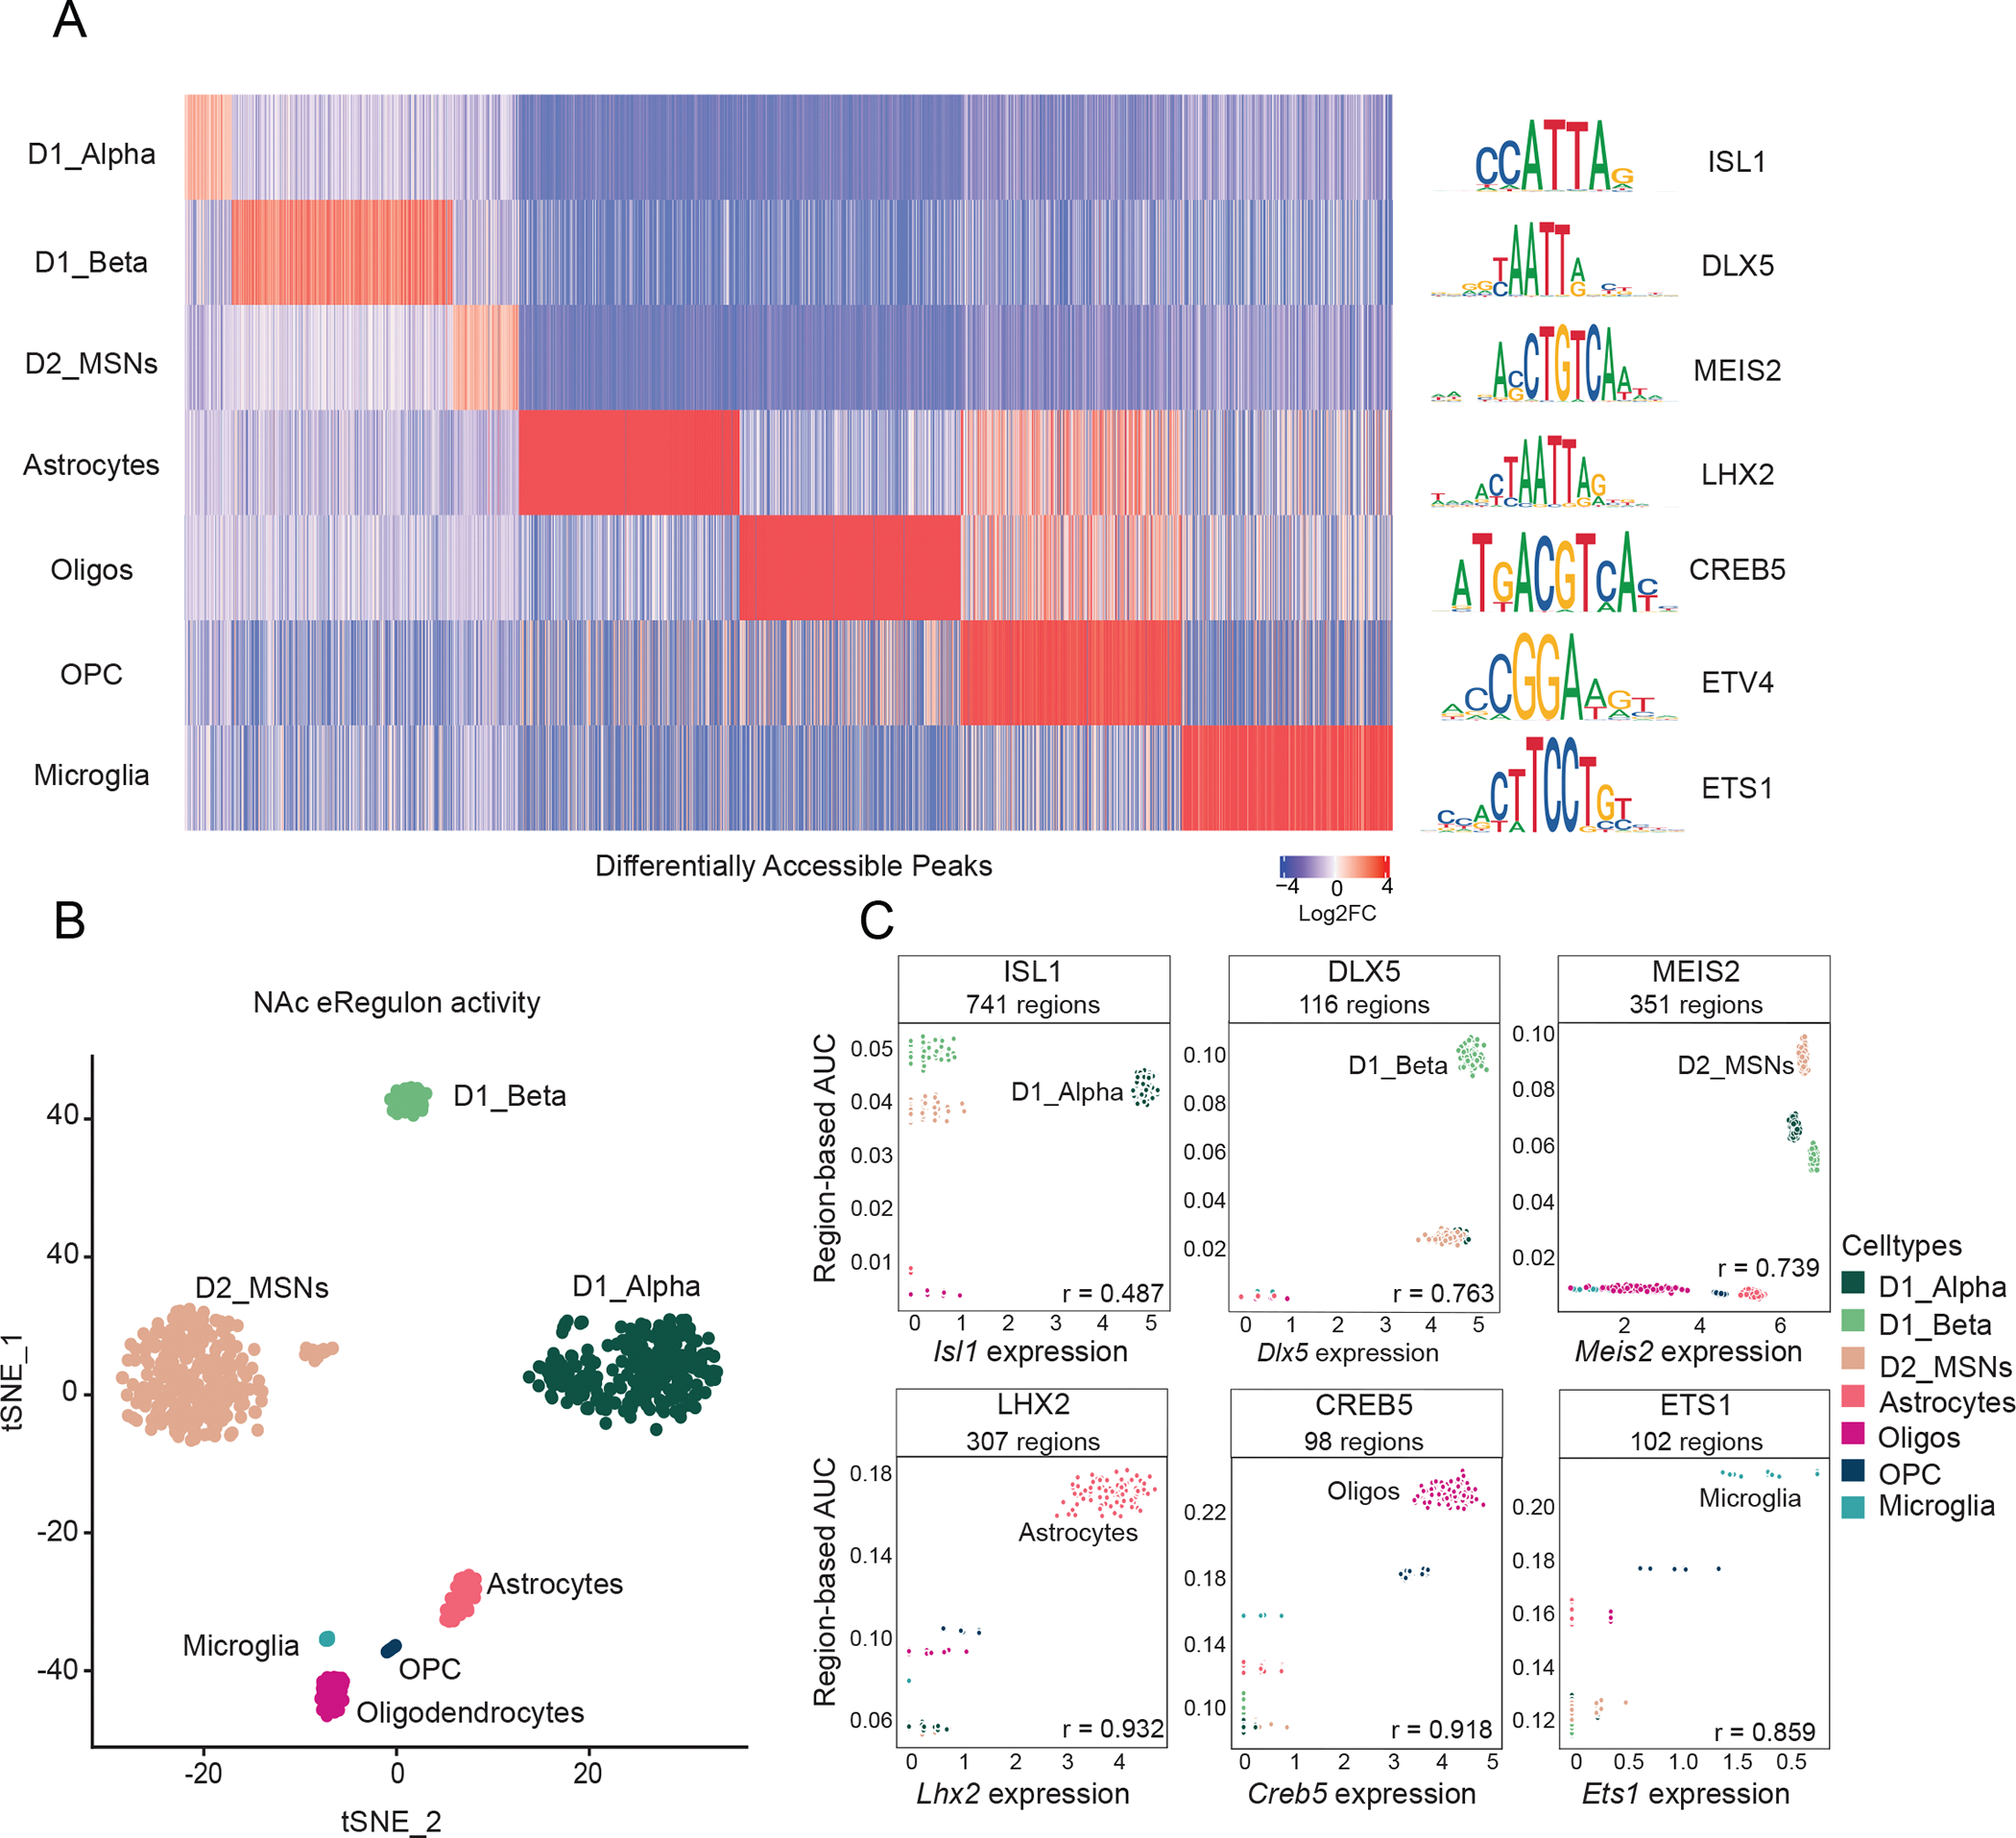
Figure 2.

A: Left) Differential chromatin accessibility of 2,740 cell-type-specific peaks (log2FC > 0.1, FDR < 0.05 in one NAc cell type compared to all other NAc cell types, top 500 peaks shown for each cell type) (see Table S1). Heatmap displays log2FC for each peak (columns) in the respective NAc cell type (rows). (Right) The transcription factor (TF) DNA binding motifs that are most significantly enriched within each cell type’s differentially accessible peaks compared to randomly selected peaks (Log2FC > 0.1, FDR < 0.05, see Table S2 for full set).
B: tSNE dimensionality reduction plot of 688 NAc pseudo-multiome cells based on gene and region eRegulon activity as computed by SCENIC+ (see methods).
C: Scatter plots of region-based eRegulon activity (AUC) (y-axis) in each NAc pseudobulk cell (see SCENIC+ methods) for TF motifs that are significantly enriched in distinct NAc cell types compared to all other NAc cell types and the normalized expression of the respective TF in each nucleus (x-axis). All Pearson’s r values are positive and are significant (p-value < 0.01).
