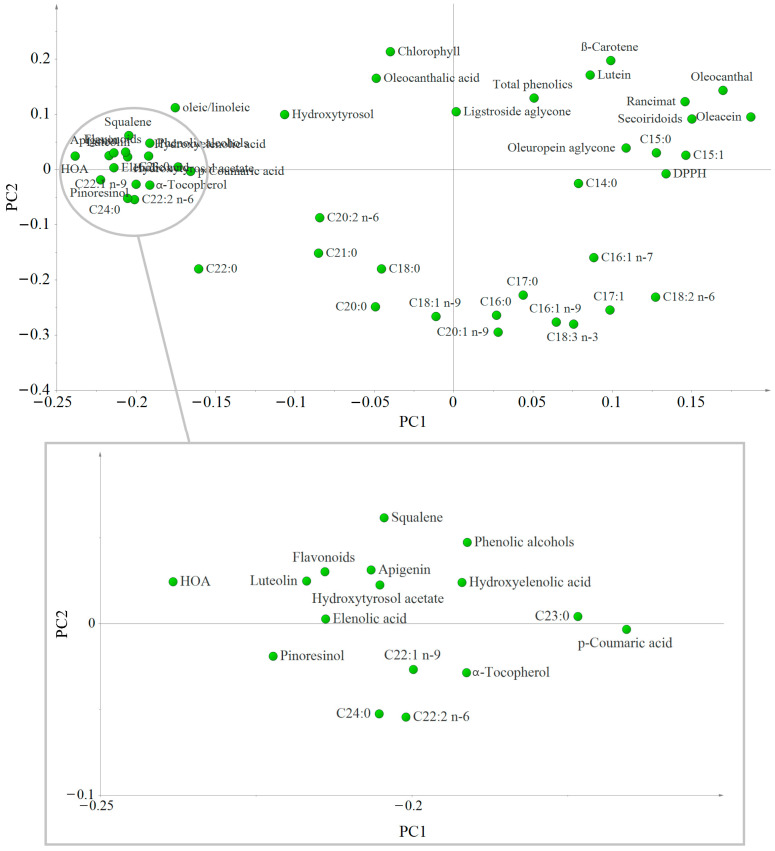
Figure 4.
Loading scatter plot of the first and second principal components of the PCA showing the distribution and correlation of the different variables analyzed in the ‘Corbella’ EVOO samples. The variables located far from the plot origin correlate to the samples positioned in the same part of the scatter plot (see Figure 2). HOA: Hydroxyoleuropein aglycone; HTA: Hydroxytyrosol acetate; HEA: Hydroxyelenolic acid.

