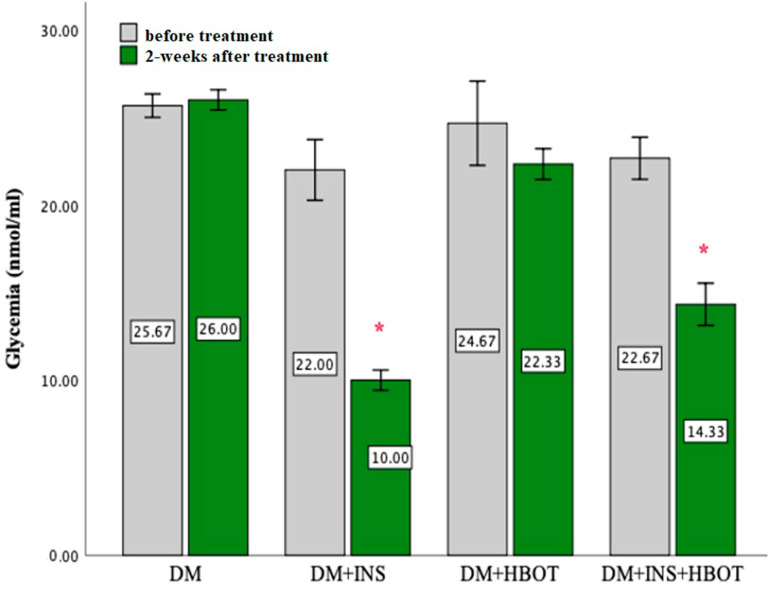
Figure 1.
Effects of DM+INS, DM+HBOT, and DM+INS+HBOT treatment on levels of glycemia in rats before and after a 2-weeks treatment. Data are presented as means ± SD. The paired t-test for testing the differences in values of glycemia was used. * p < 0.05 within−group difference (DM, DM+INS, DM+HBOT, and DM+INS+HBOT) after 2-week treatment.

