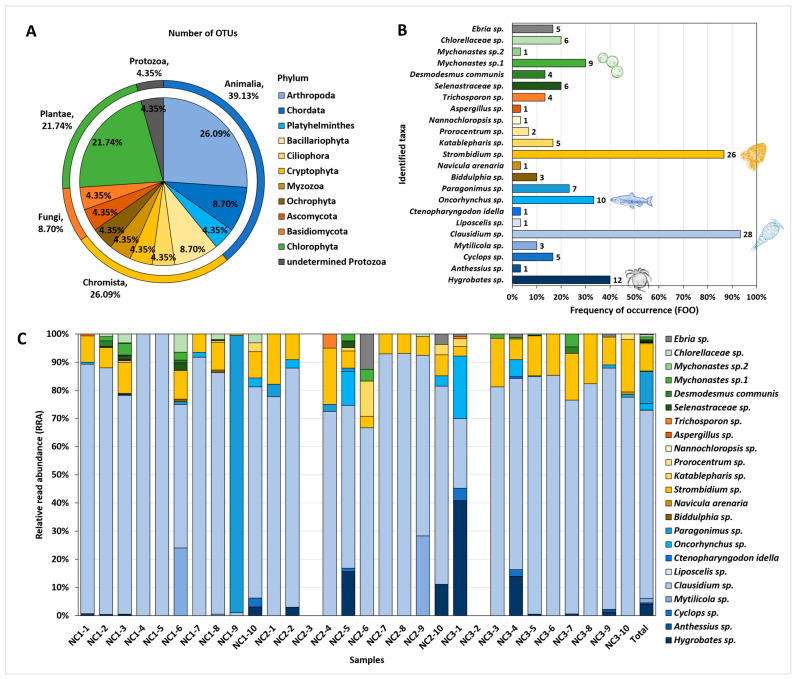
Figure 2.
Overall taxa composition detected from the gut contents of C. fluminea (n = 30). Each colour sector represents a different kingdom group (blue: Animalia, yellow: Chromista, orange: Fungi, green: Plantae, grey: Protozoa). (A) The number of OTUs represented as a proportion based on each phylum and kingdom group. (B) Frequency of occurrence (FOO) for each OTUs. The number at the edge of the bars refers to the number of C. fluminea samples in which the taxon detected. (C) Relative read abundance (RRA) for each OTU. The sample name represents each of the 10 samples collected from three different sampling points.

