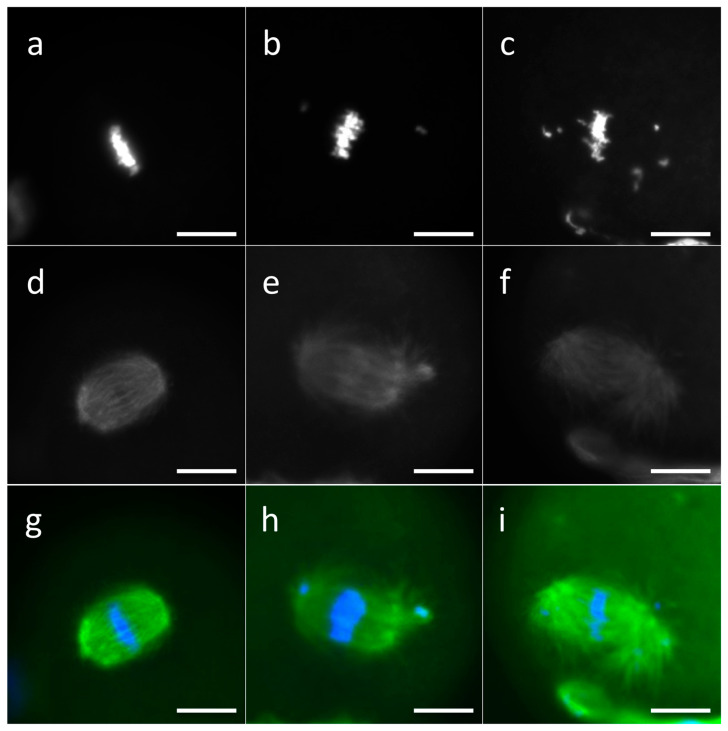
Figure 1.
Representative images of MII plate in MII oocytes. Chromosomes were classified as normal (a), slightly aberrant (b), or aberrant (c). Spindle was classified as normal (d), slightly aberrant (e), or aberrant (f). Merged images of DNA and spindle staining are presented (g–i). MII oocytes were labeled by mouse anti α-tubulin primary antibody and secondary antibody conjugated with DyLight® 594, and chromatin staining was performed by Hoechst 33342. Scale bars: 10 μm.

