Figure 4.
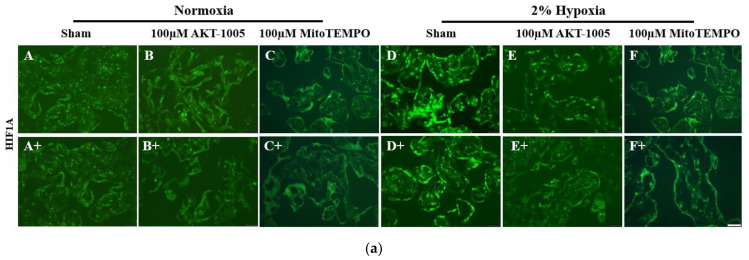
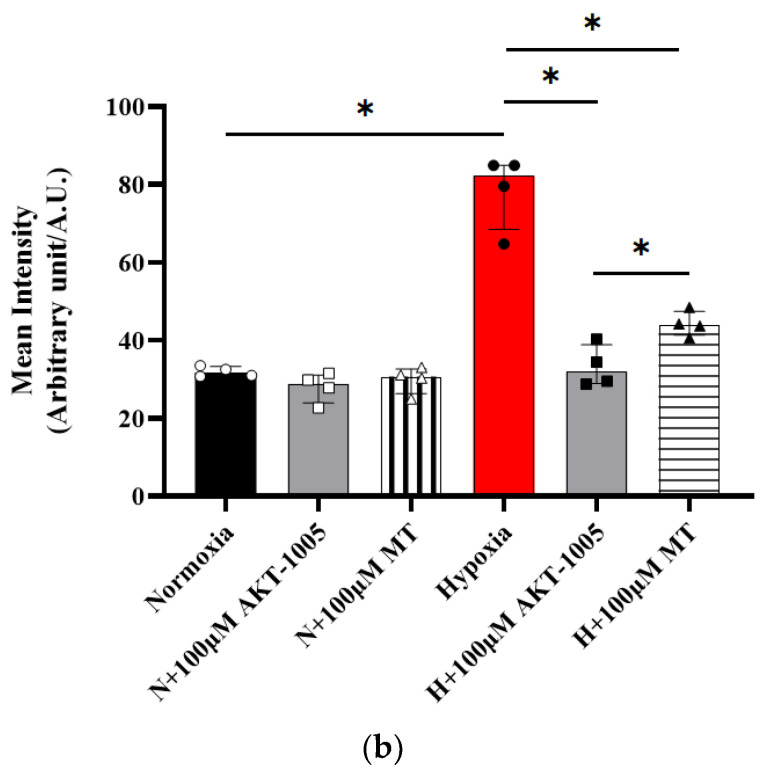
Compound AKT-1005 pre-treatment reduced HIF1A expression in 2% O2-exposed human villous explants. (a) Immunofluorescent staining of HIF1A transcription factor expression (A–F and A+–F+) in human villous explants treated with 100 μM AKT-1005 and 100 μM MitoTEMPO for 30 min, then exposed to 24 h of 2% hypoxia. A bright green color indicates HIF1A expression. Scale bar: 200 µm. (b) Quantitation of HIF1A immunofluorescence in trophoblasts: the mean optical density of whole cell surface area was calculated in four high-power fields per sample (n = 4 per group). Mann-Whitney U test, median [IQR]. Abbreviation: MT = MitoTEMPO. Normoxia vs. Hypoxia: *: p < 0.05; Hypoxia vs. H+100 µM AKT-1005: *: p < 0.05; Hypoxia vs. H+100 µM MT: *: p < 0.05; and H+100 µM AKT-1005 vs. H+100 µM MT: *: p < 0.05.


