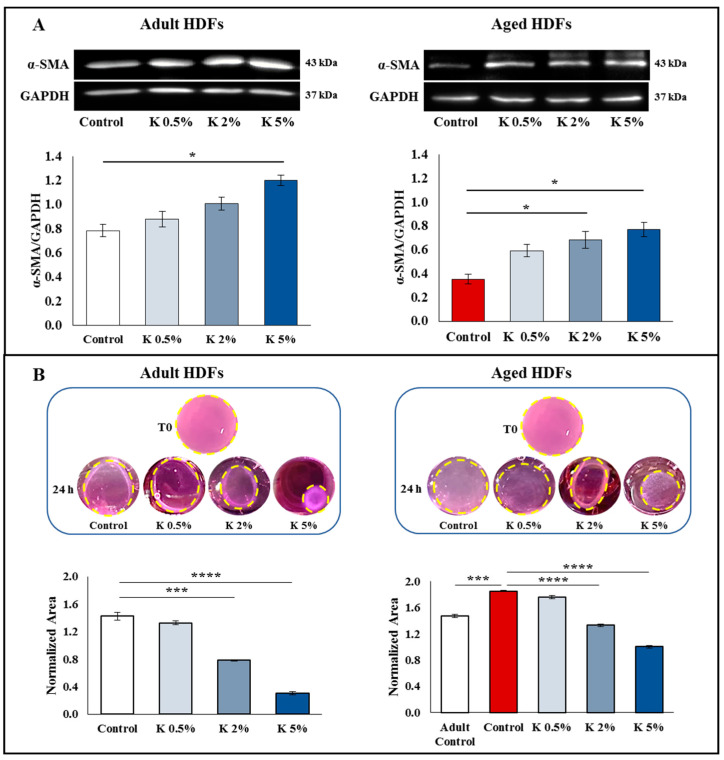
Figure 4.
Influence of K formulation treatment on fibroblast activation. (A) Western blot assay for α-SMA was performed on adult and aged HDFs treated with increasing concentrations of K for 72 h. Following the densitometric analysis, the obtained values were normalized vs. GAPDH protein. Values are expressed as the means ± SEM of two independent experiments. Representative immunoblots are also shown. (B) Collagen gel retraction assay was performed on adult and aged HDF-populated collagen lattices following K treatment. The gel contraction was evaluated by digital camera, and the lattice area was assessed by ImageJ and normalized to pre-release area (T0). Normalized area values are reported as mean ± SEM of three independent experiments in duplicate. Representative images of lattices at T0 and 24 h after treatments are also shown. The yellow dotted circles mark the lattice’s edges. The comparative analysis of data was performed using one-way ANOVA followed by Dunnett’s post hoc test (* p < 0.05, *** p < 0.001, **** p < 0.0001).

