Figure 2.
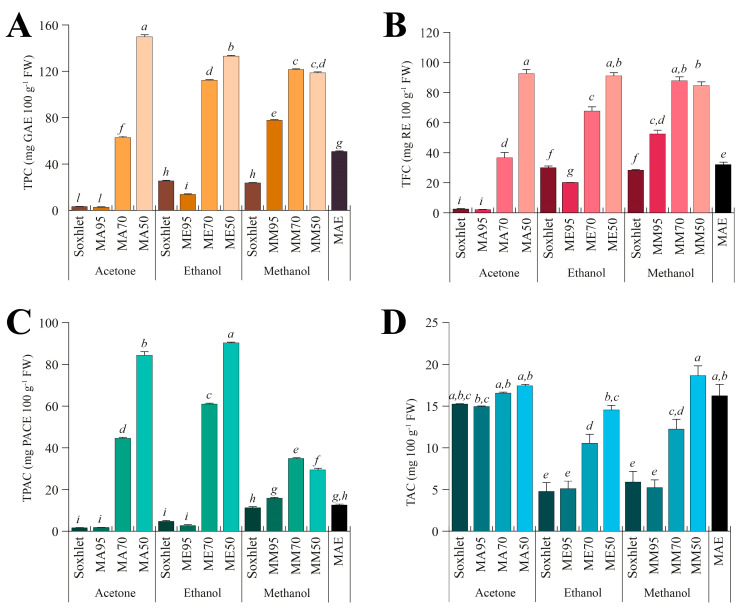
Total content of polyphenols (TPC, (A)), flavonoids (TFC, (B)), proanthocyanidins (TPAC, (C)), and alkaloids (TAC, (D)) measured in the different seed extracts of G. simplicifolia. Plots report the content of bioactive components according to the extraction technique (Soxhlet, maceration, or microwave-assisted), the type of solvent used (acetone, ethanol, or methanol), and the amount of water added for maceration (M95, M70, or M50). MAE, microwave-assisted extraction. Bars represent the content expressed as mg 100 g−1 fresh weight (FW), and the metric bars are the standard deviation. Lowercase letters above each bar indicate statistical differences (p < 0.05) as assessed by one-way ANOVA followed by Tukey’s post hoc.

